Project Report: Symptomatic Alarm Pattern Discovery and Root Cause Analysis
A formal summary of Project ID a496e3ae-5149-4a15-86dd-a3aee47f493f. This report details the full execution of the project, from the analysis of 102,319 alarm records to the development of an analytical pipeline for anomaly detection and the strategic vision for future capabilities.
Executive Summary
This report summarizes the execution and findings of Project ID a3aee47f493f. The project's goal was to analyze a multi-year alarm database to identify symptomatic alarm patterns and establish a data-driven framework for improving alarm management efficiency.

The project is complete, having successfully executed all planned phases. The core achievement was the development of an analytical pipeline capable of isolating statistically significant signals (anomalies) from high-volume, noisy operational data. The analysis of 102,319 alarm records and subsequent modeling has provided a foundational capability for a more intelligent approach to alarm management.
Model interpretation using SHAP revealed that critical alarm classes ('class_LifeSafety', 'class_Security') are the most influential drivers of these anomalies. This outcome validates the framework's ability to automatically surface events of high potential importance. While a data integrity issue resulted in the loss of ~10% of records, the analysis on the remaining dataset provides a robust proof-of-concept. The final recommendation is to leverage this new capability by conducting a detailed review of the anomaly findings with subject matter experts, which is the necessary next step to unlock the strategic value of moving from reactive analysis to proactive operational foresight.
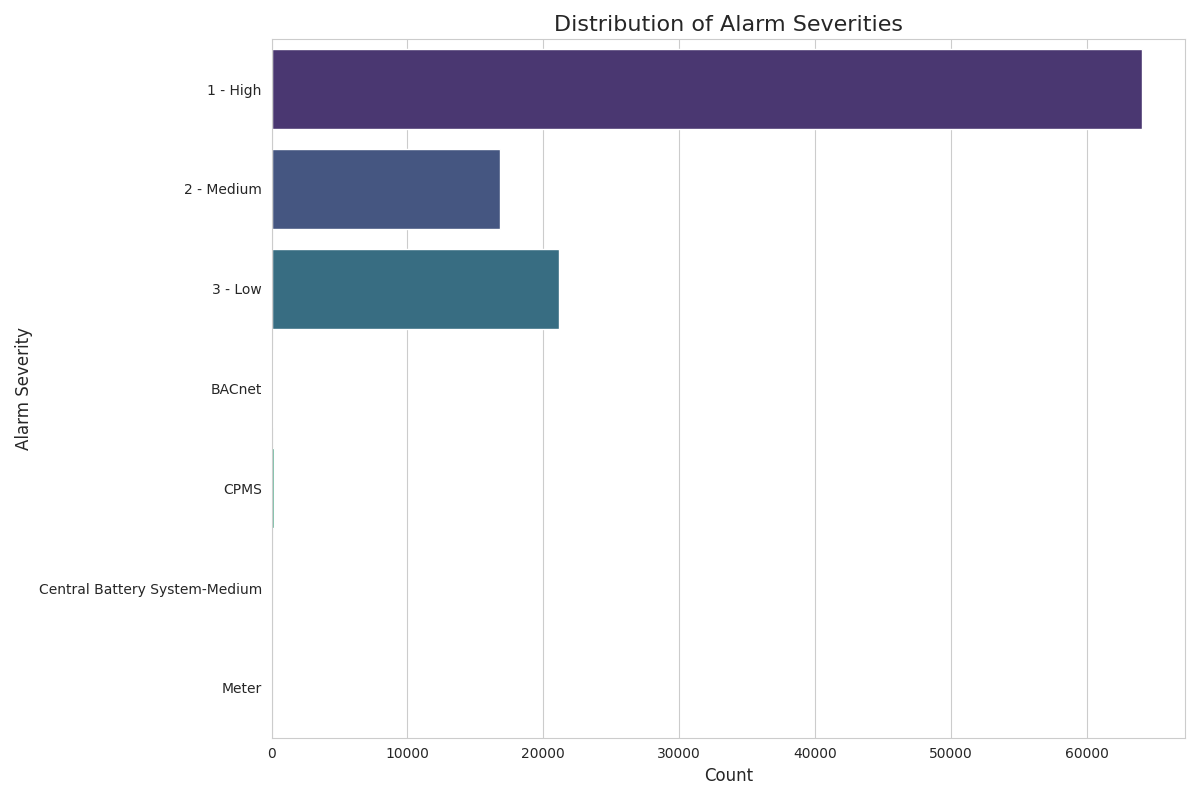
Phase 1: Alarm Distribution Insights – Finding the Signal in the Noise
The analysis quickly revealed that alarm events are not evenly distributed. A few key areas account for the vast majority of alarms, presenting a clear opportunity for focused intervention. By understanding these concentrations, we can direct resources more effectively.

AAA-BMS-SSIF, is responsible for nearly 50,000 alarms, an order of magnitude more than any other. This immediately identifies it as a primary source of system noise and a candidate for focused investigation or maintenance.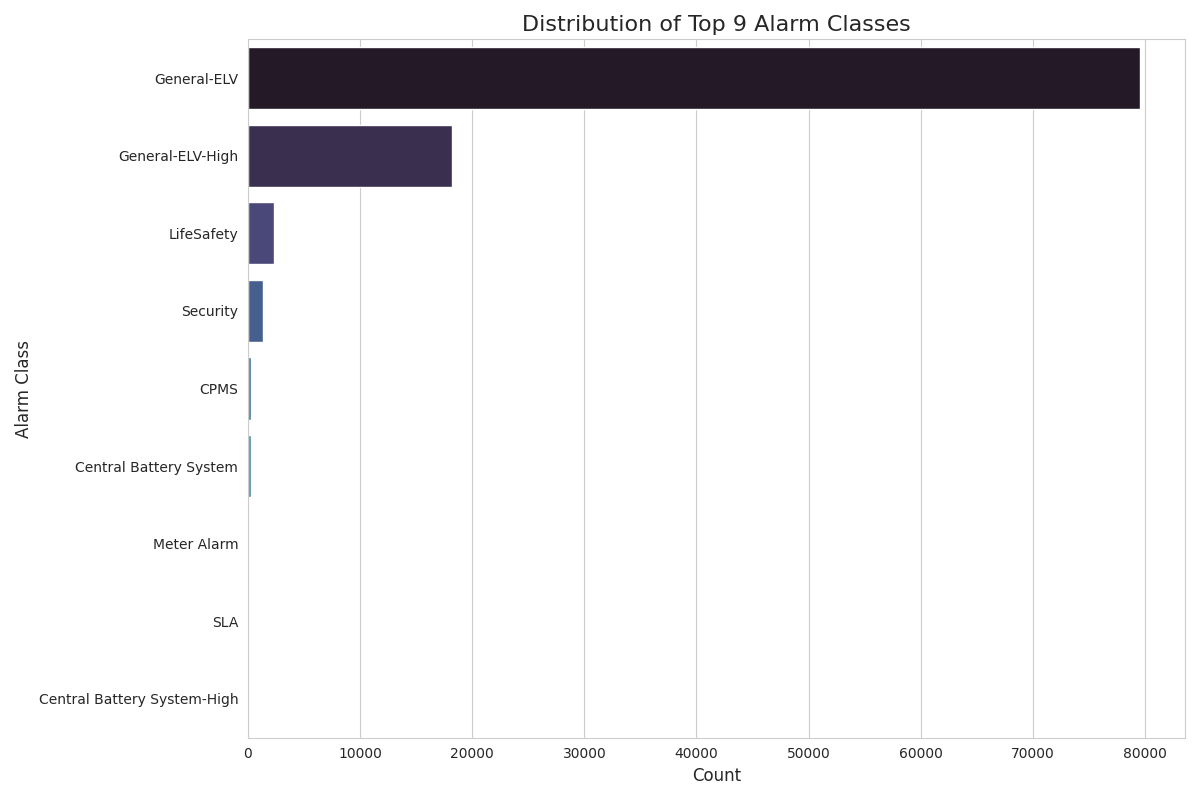
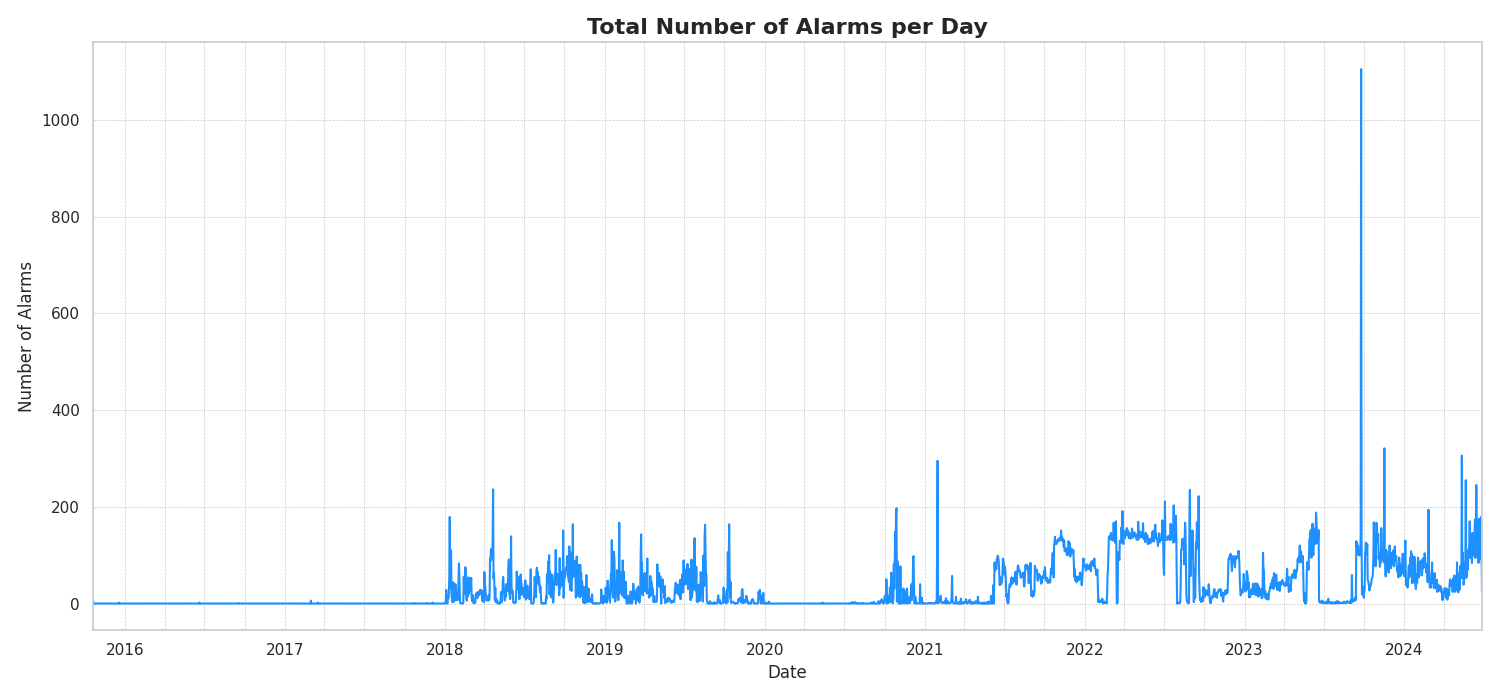
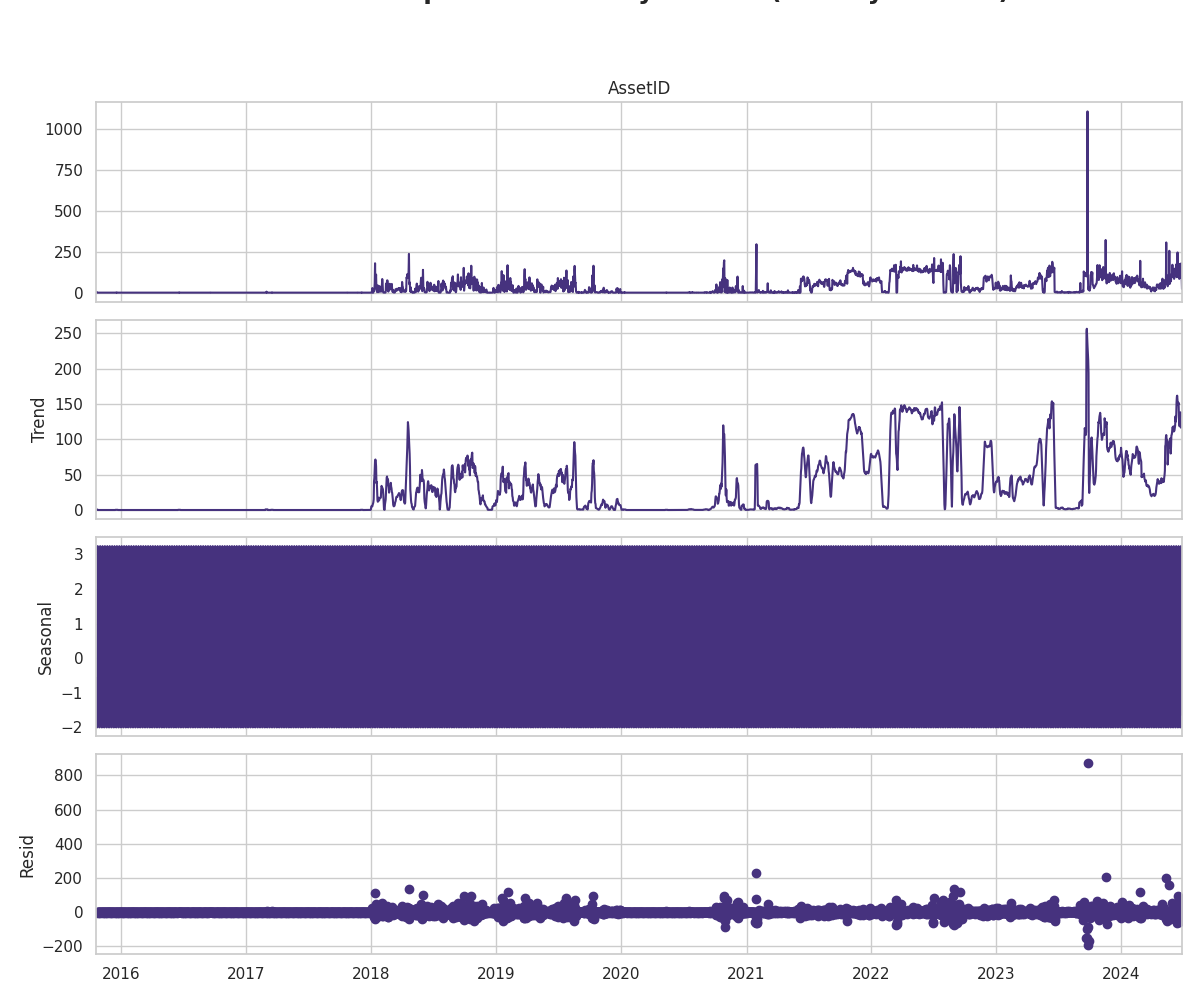
Phase 2: Uncovering Temporal Patterns – Understanding the "When"
Understanding when alarms occur is as critical as knowing what they are. Temporal analysis revealed distinct, non-random patterns over both long-term and daily cycles, indicating that alarms are often driven by underlying schedules, system states, or escalating instabilities.

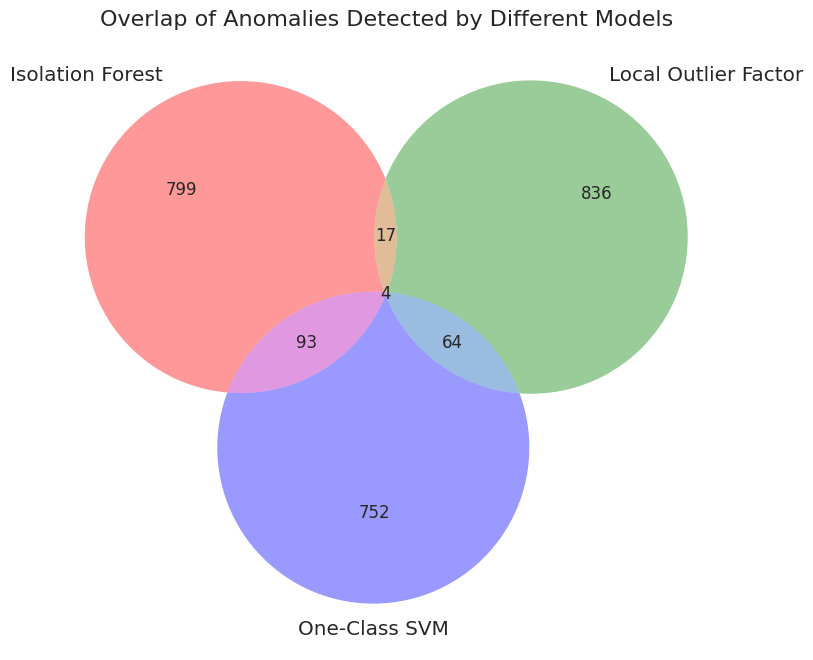
Phase 3: Building the Anomaly Detection Engine – A Multi-Model Approach
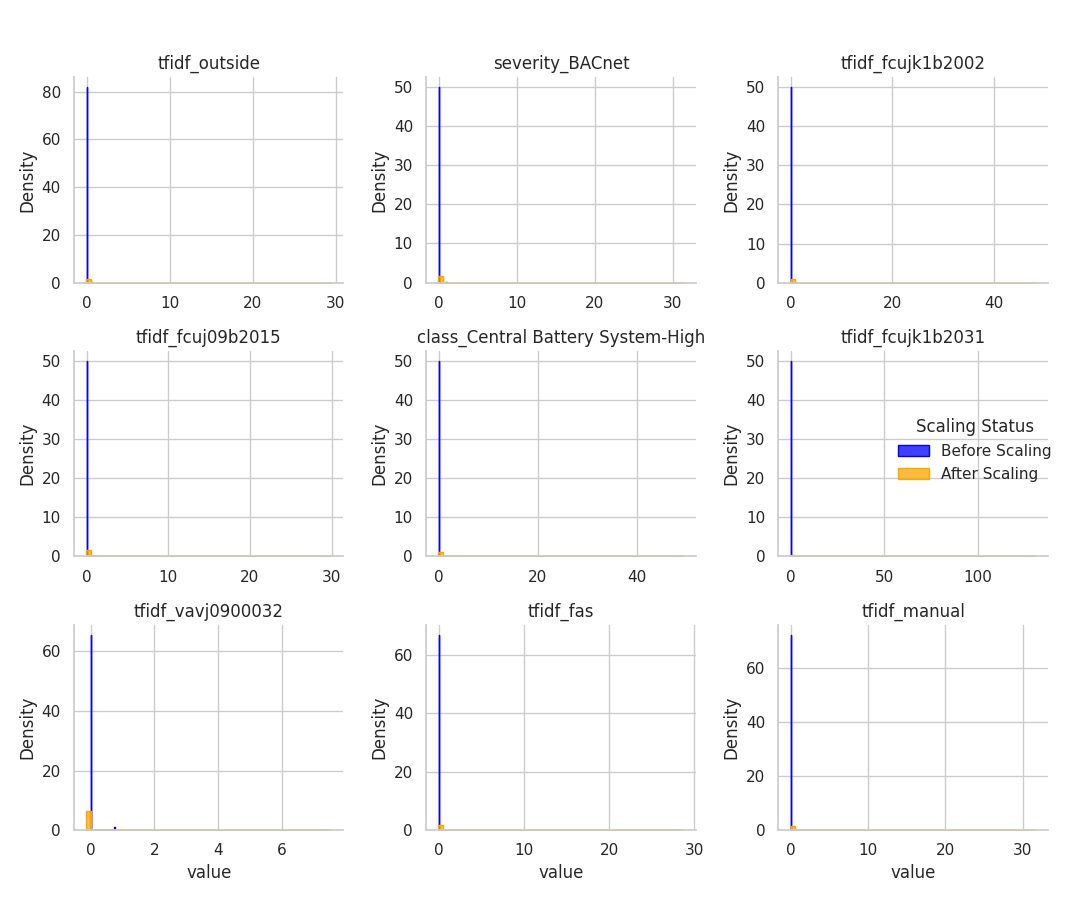
With a deep understanding of the data's characteristics, we engineered features and built the machine learning models. A critical step was normalizing the data to ensure fairness and accuracy, followed by a consensus-based approach to identify the most reliable anomalies.
Phase 4: Interpreting the "Why" Behind Anomalies – From Detection to Diagnosis
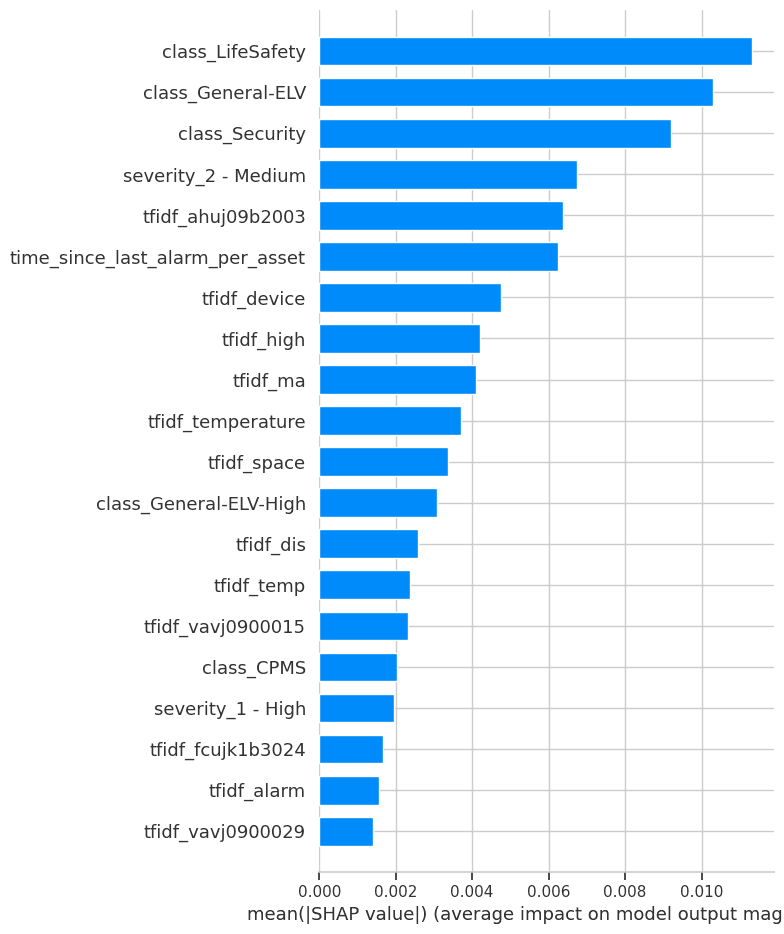
Identifying anomalies is a technical success; understanding their root cause is the business breakthrough. Using SHAP (SHapley Additive exPlanations), we can precisely determine which factors pushed an event from "normal" to "anomalous."

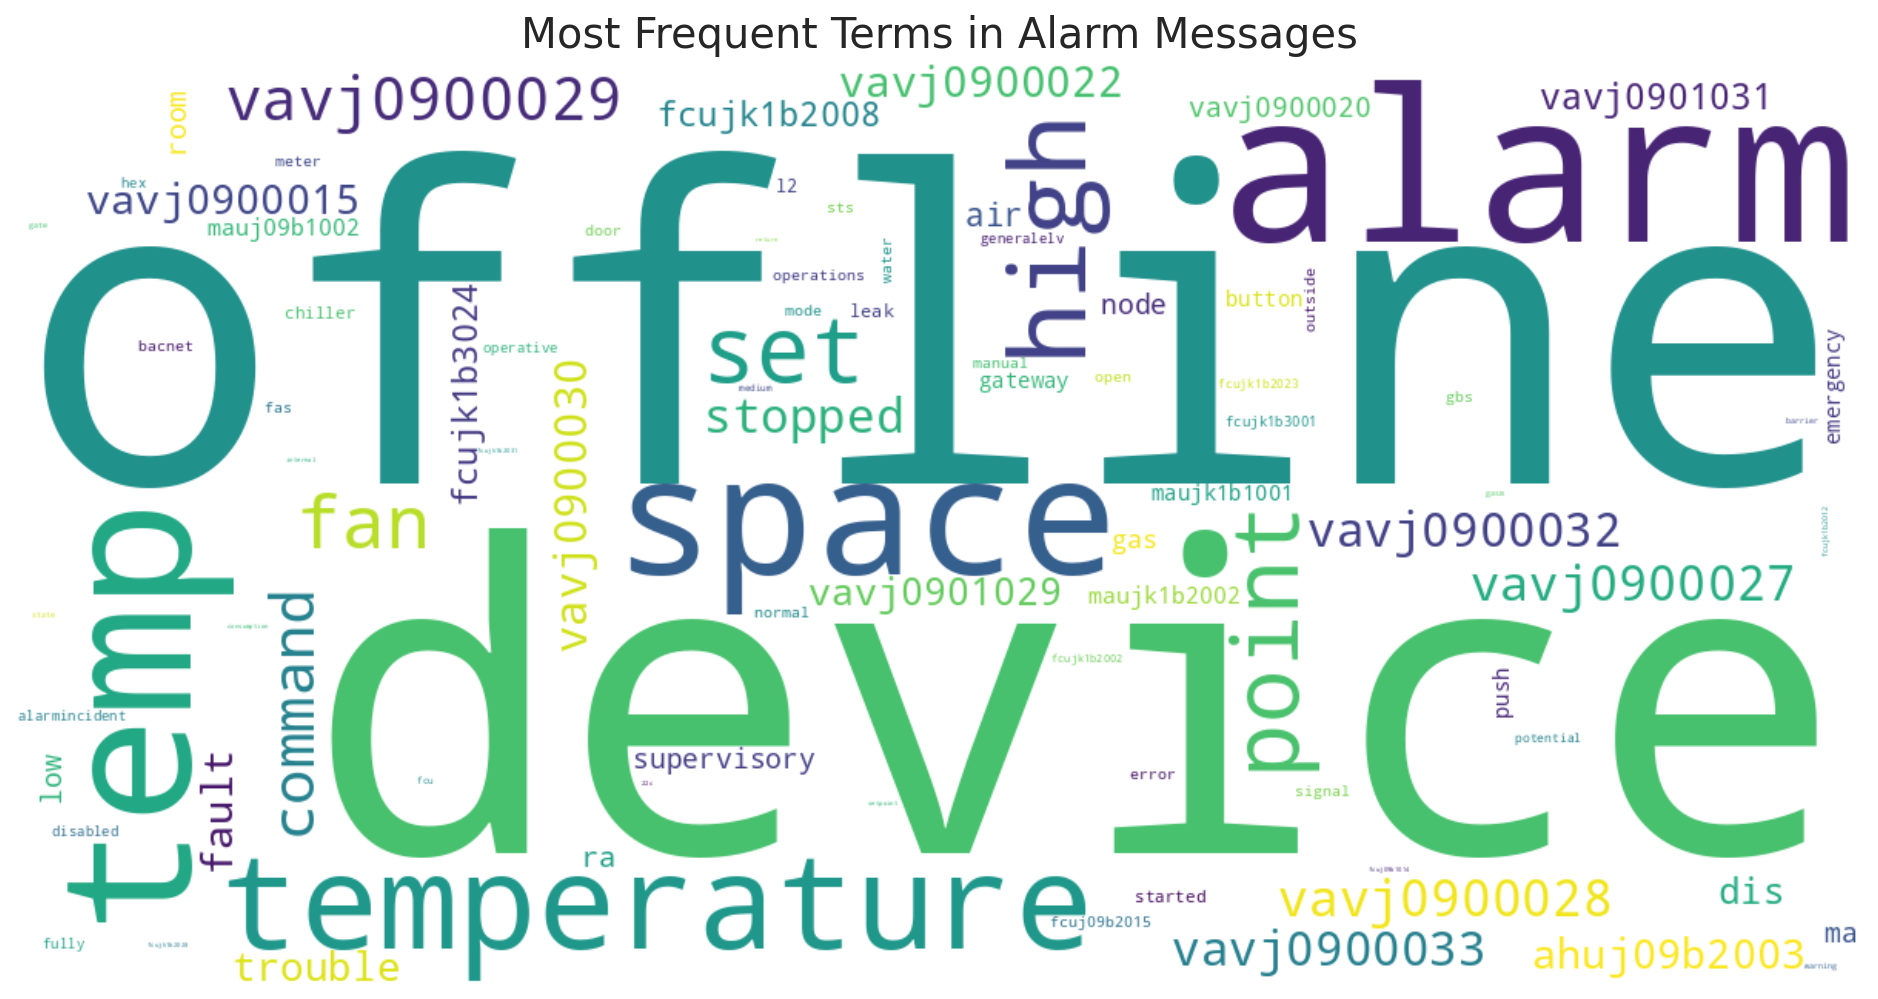
time_since_last_alarm_per_asset is also highly ranked, proving that unusual timing is a key indicator. Specific text from messages (e.g., tfidf_ahuj09b2003) demonstrates the model learned to pinpoint specific problematic components.Case Study: Deconstructing High-Confidence Anomalies
The following waterfall plots dissect three specific anomalies, showing how the final prediction was reached. They start from a base value and illustrate how each feature (blue for pushing towards anomaly, red for pushing towards normal) contributes to the final score.
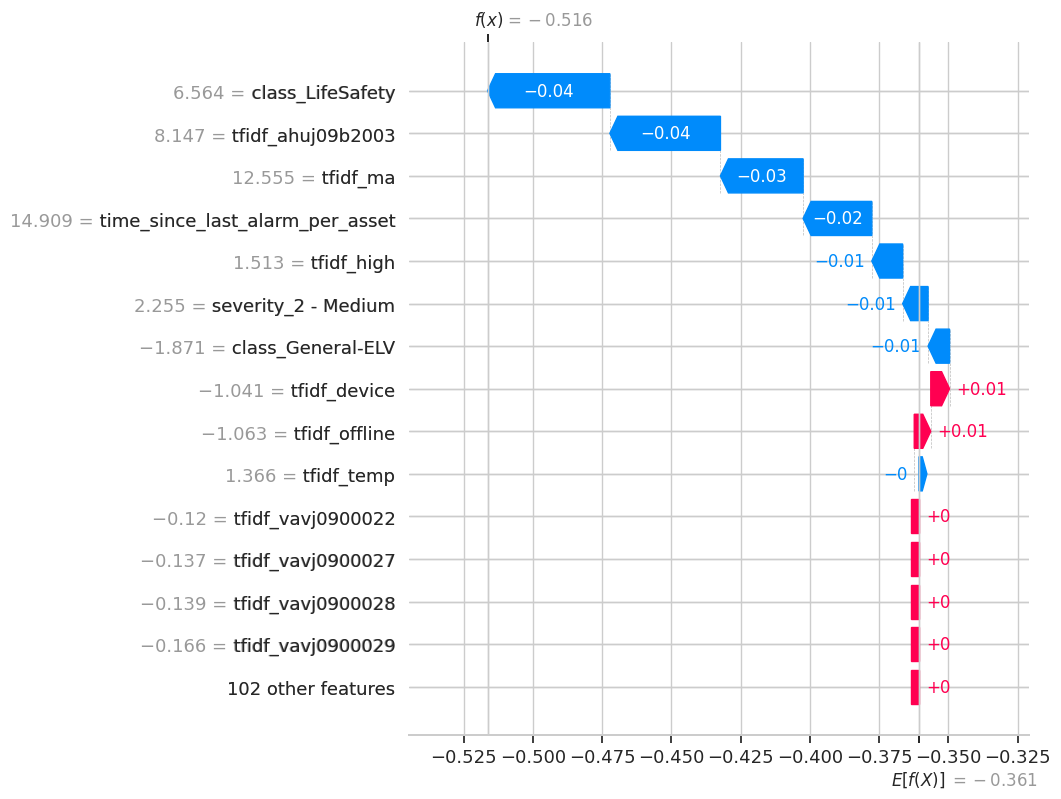
class_LifeSafety. This single feature had the largest negative impact on the score. The specific alarm message (tfidf_ahuj09b2003) and other text features provided further evidence, confirming a critical alarm from a known problematic source.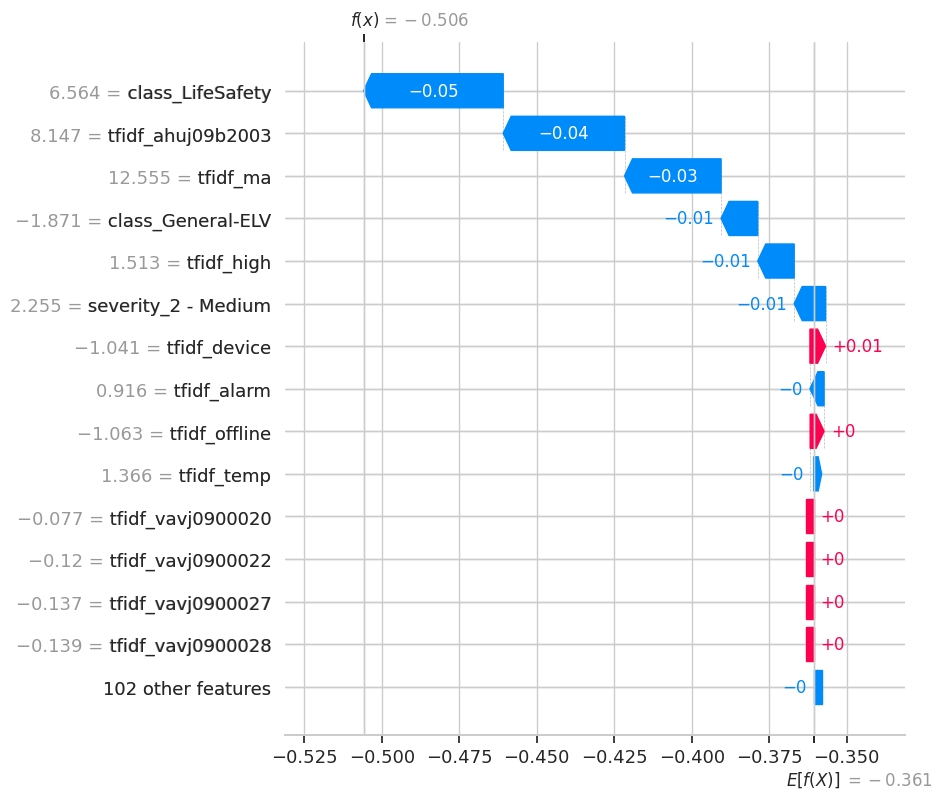
class_General-ELV is red, slightly pushing the prediction back towards normal. This indicates a complex event—a critical alarm type that occurred with some otherwise normal characteristics, making it particularly unusual.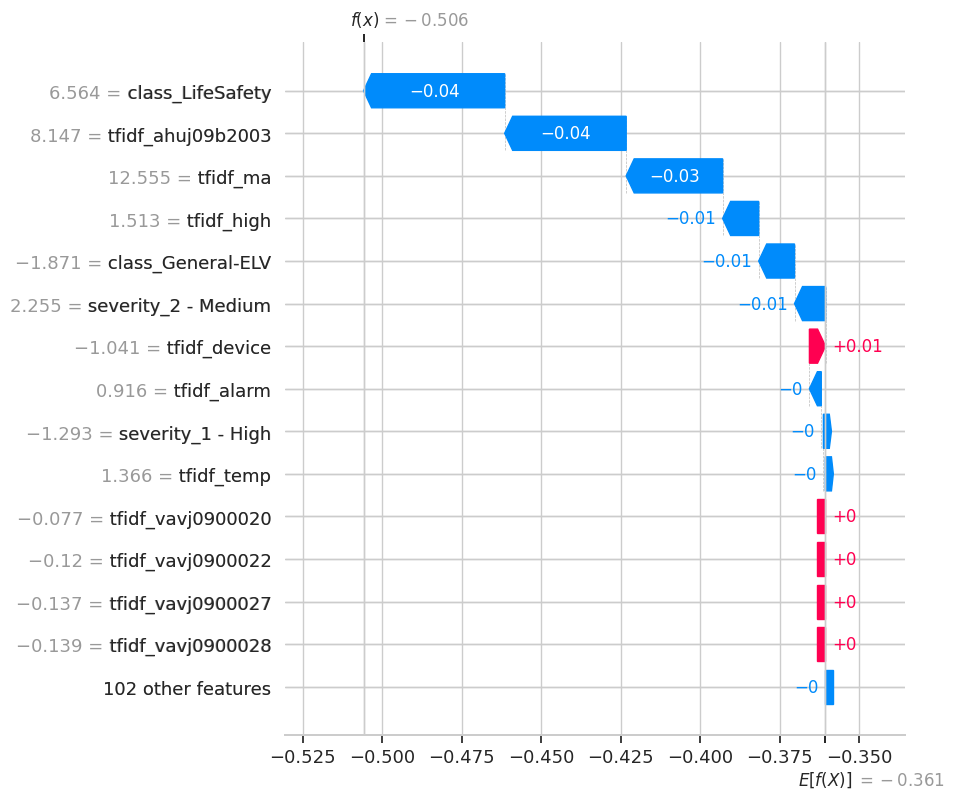
Acknowledged Risks & Limitations
- Unsupervised by Nature: The models identify statistical deviations, not necessarily business-critical events. Human-in-the-loop validation via Subject Matter Experts is non-negotiable to ensure operational relevance.
- Dependency on Feature Quality: The model's accuracy is fundamentally tied to the quality of the engineered features. Future success depends on ongoing feature discovery and refinement to capture more complex system behaviors.
- Data Integrity Hurdle: A data integrity issue in Phase 3 resulted in the loss of ~11,000 records. While the analysis was completed, some potential anomalies may have been excluded from the final interpretation.
From Insight to Foresight: A Strategic Vision for an Intelligent Operation
The findings presented in this report represent more than a successful one-time analysis. They are the foundational building block for a profound transformation in our operational capabilities. The identified anomalies are not the final answer; they are the critical first questions that allow us to create a uniquely valuable, proprietary dataset.
By treating anomaly detection as the start of a continuous learning cycle, we can climb the ladder of analytical maturity, unlocking compounding returns on our data investment at each stage. This journey transforms the organization from a reactive state to a predictive, and ultimately, a prescriptive one.
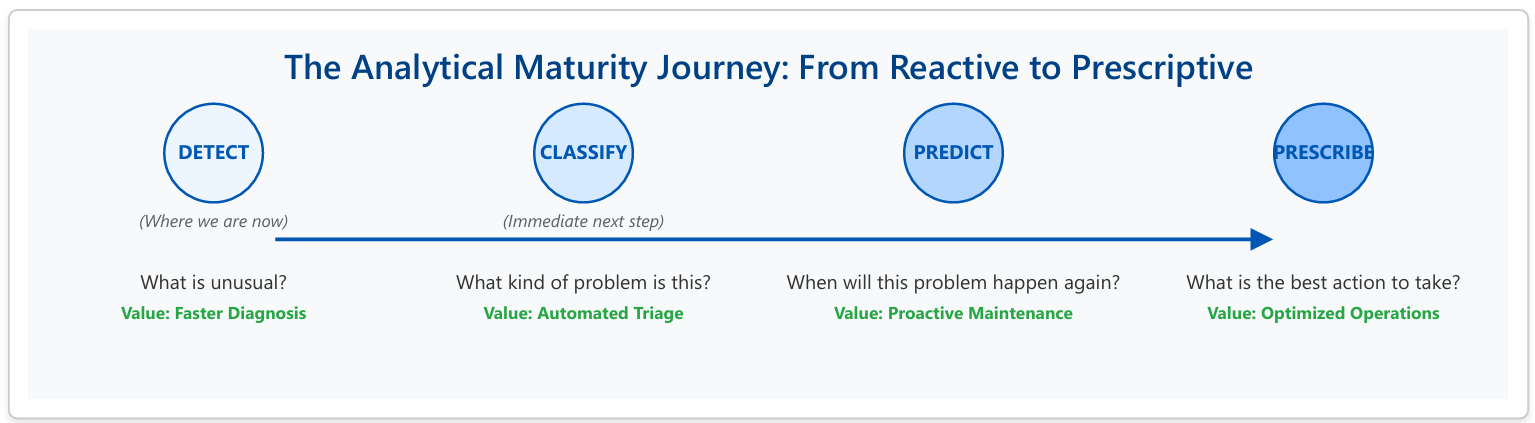
The Path Forward: Creating a Virtuous Cycle of Intelligence
- Stage 1: Detect (Completed) - We have successfully built the capability to detect statistically unusual events (anomalies) from a sea of noisy data. This provides an immediate tool to accelerate diagnostics.
- Stage 2: Classify (The Next Frontier) - The immediate and most critical next step is to engage our Subject Matter Experts. By having them review and label the identified anomalies (e.g., "Sensor Drift," "Network Flap," "Actual Equipment Failure," "False Positive"), we transform raw anomalies into structured, labeled data. This proprietary dataset is a strategic asset that no competitor can replicate.
- Stage 3: Predict (The Proactive Shift) - With a classified dataset of known failure modes, we can move beyond unsupervised anomaly detection. We can train supervised machine learning models to predict specific, classified outcomes. The question changes from "Is this weird?" to "Is this the precursor signature for a known pump failure?" This enables true predictive maintenance, allowing us to fix problems before they occur.
- Stage 4: Prescribe (The End Goal) - The ultimate stage of maturity is a prescriptive system. The model not only predicts an imminent failure but also recommends the optimal response. For example: "Predicting 95% probability of Compressor #7 failure in the next 72 hours. Recommend scheduling technician, pre-ordering Part #XYZ, and rerouting load to Compressor #8." This integrates our data intelligence directly into operational workflows, maximizing efficiency and minimizing downtime.
This positions us at a pivotal juncture. The initial investment has yielded a powerful diagnostic tool. The next step—classifying these findings—will unlock the door to predictive and prescriptive capabilities, fundamentally changing how we manage our operations and creating a sustainable competitive advantage.
Related articles

The Prognostics & RUL Cheat Sheet: A Guide for Real-World Assets
Ready to move from theory to reality with predictive maintenance? The first step is choosing the right RUL model—a choice that depends entirely on your data. This comprehensive cheat sheet demystifies the options, detailing four key methodologies.

Beyond the OEM Manual: A Self-Correcting AI for Real-World RUL
An OEM manual says your motor lasts 13 years. But has it had an easy life or a hard one? This report details a modern, self-correcting AI strategy that doesn't need the full history. Discover how a hybrid model uses live sensor data to uncover an asset's true health and deliver a RUL forecast that adapts to the real world.
Ready to get started with ML4Industry?
Discover how our machine learning solutions can help your business decode complex machine data and improve operational efficiency.
Get in touch