The truth about AI's report card: why your machine learning model might be lying to you!
Your AI model has 95% accuracy? So does a plane navigation system that only fails during landing. Not all errors are created equal.

The truth about AI's report card: why your machine learning model might be lying to you
Picture this: You're about to board a plane, and the pilot announces, "Good news, everyone! Our navigation system is 95% accurate!" Would you feel confident? What if I told you that the 5% error only happens during landing?
This is exactly what's happening in boardrooms across the world right now. Data scientists are presenting impressive-sounding metrics—MAE, RMSE, MAPE—while executives nod along, not fully understanding what these numbers really mean for their business. Today, we're going to decode this alphabet soup and reveal why your AI might be getting an A+ on the wrong test.
The great AI grading scandal
Here's the uncomfortable truth: most people evaluating AI systems don't understand how they're being graded. It's like judging a chef solely on how fast they can chop vegetables, ignoring whether the food actually tastes good.
In the world of machine learning—whether we're talking about the latest GPT models, BERT transformers, or even simple regression algorithms—we've created a complex grading system. But unlike school, where 90% is always good, in AI, context is everything.
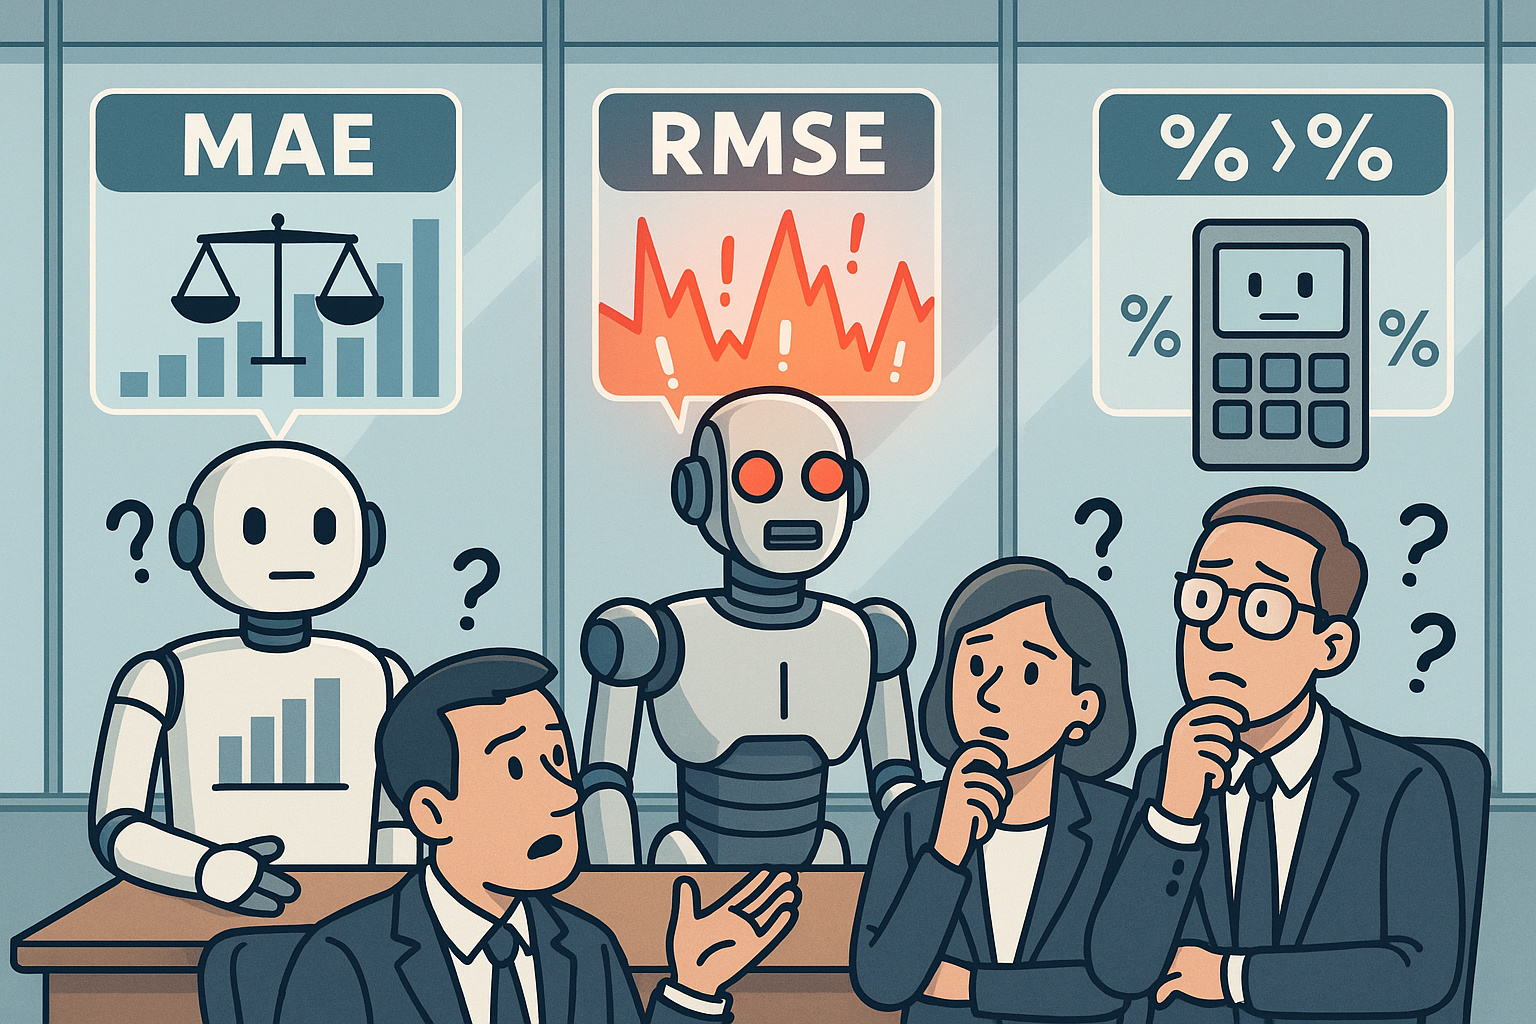
Fig. 1: They are very meaningfull and use the with care, they can save you millions
MAE: the honest broker
Let's start with MAE—Mean Absolute Error. Think of MAE as your brutally honest friend who tells you exactly how wrong you are, on average.
Imagine you're predicting tomorrow's temperature. If your weather app says it'll be 75°F, but it turns out to be 70°F, your error is 5 degrees. Do this every day for a month, average those errors, and voilà—you have your MAE.
The beauty of MAE: It treats all mistakes equally. Whether you're off by 5 degrees too high or 5 degrees too low, it counts the same. No drama, no exaggeration.
Real-world example: A smart irrigation system predicting water demand with an MAE of 50 gallons per hour means that, on average, it's off by about 50 gallons. For a small farm, that might be catastrophic. For a major agricultural operation using thousands of gallons per hour, it might be a rounding error.
RMSE: the drama queen
Now meet RMSE—Root Mean Squared Error. If MAE is your honest friend, RMSE is the one who turns every small problem into a crisis. And sometimes, that's exactly what you need.
RMSE squares each error before averaging (then takes the square root to get back to your original units). This means big mistakes get amplified. Miss by 10 units instead of 1? RMSE doesn't just notice—it screams about it.
Why this matters: In many real-world applications, big errors are disproportionately costly. If your autonomous vehicle's perception system (powered by CNNs—Convolutional Neural Networks) is usually accurate within inches but occasionally misses by several feet, RMSE will catch that critical flaw while MAE might let it slide.
MAPE: the percentage perfectionist
MAPE—Mean Absolute Percentage Error—is the relativist of the group. It doesn't care about absolute numbers; it cares about proportions.
A 10-unit error predicting sales of 100 units (10% error) is treated the same as a 100-unit error predicting sales of 1,000 units (also 10% error). This makes MAPE incredibly useful when comparing predictions across different scales.
The catch: MAPE breaks when dealing with values close to zero. It's like trying to calculate what percentage of nothing something is—mathematically problematic and philosophically confusing.
The metrics masquerade ball
Here's where things get interesting. In the age of deep learning, where models like RNNs (Recurrent Neural Networks) process sequences and transformers like BERT understand context bidirectionally, these simple metrics are both more important and more misleading than ever.
A language model might achieve impressive accuracy on benchmark tests while completely failing at real-world tasks. It's like a student who memorizes answers without understanding concepts—great test scores, terrible application.

Fig. 2: Futuristic industrial water treatment plant control room
The classification conundrum
But wait, there's more! Everything we've discussed applies to regression problems (predicting continuous values). Classification problems—like determining if an email is spam or if a medical image shows cancer—use entirely different metrics:
- Accuracy: The percentage of correct predictions (dangerous when classes are imbalanced)
- Precision: When the model says "yes," how often is it right?
- Recall: Of all the actual "yes" cases, how many did the model find?
- F1-Score: The harmonious balance between precision and recall
- AUC-ROC: How well the model distinguishes between classes across all thresholds
Each tells a different story. High accuracy might hide the fact that your model never detects rare but critical events. High precision might mean you're missing most positive cases.
The modern ML metrics maze
In 2025, evaluation metrics in machine learning include not just traditional measures but sophisticated approaches for handling multi-class classification, time series, and even multimodal models. As models become more complex—think large language models (LLMs) like GPT-4 or multimodal systems that process both text and images—our evaluation strategies must evolve too.
Consider how we evaluate conversational AI. Traditional metrics might show that a chatbot correctly predicts the next word 95% of the time, but users might still find conversations frustrating. This is why modern evaluation includes human-in-the-loop metrics, task-specific benchmarks, and even ethical considerations.
The overfitting Olympics
Here's a dirty secret: it's surprisingly easy to game these metrics. Give a model enough parameters (modern LLMs have hundreds of billions), and it can memorize training data, achieving near-perfect scores while being utterly useless on new information.
This is why we split data into training, validation, and test sets. But even then, when everyone uses the same benchmarks, models can indirectly overfit to test data through repeated iteration and publication bias.
The business translation challenge
So how do you explain this to your CEO? Here's a practical framework:
- Start with business impact: "Our demand prediction errors cost us $X per unit"
- Translate metrics to money: "Reducing RMSE by 10% saves approximately $Y annually"
- Acknowledge limitations: "These metrics assume normal operations—they don't account for black swan events"
- Compare to baselines: "This is 40% better than our current manual process"
The uncomfortable questions
When someone presents you with model metrics, ask:
- What's the business cost of different types of errors?
- How does performance vary across different segments?
- What's the worst-case scenario the model might miss?
- How does this compare to simple baseline methods?
Remember: a complex neural network that's 2% better than a simple linear regression might not be worth the added complexity, maintenance cost, and lack of interpretability.

Fig. 3: classroom where an AI robot student holds up a glowing report card with A+ grades in 'MAE', 'RMSE', 'F1-SCORE' while completely failing at simple real-world tasks around it
The future of model evaluation
As we advance toward artificial general intelligence (AGI), our evaluation methods must evolve. We're already seeing this with models like OpenAI's o1 and DeepSeek's R1, which are specifically designed for complex reasoning tasks and show significant improvements in mathematics, science, and coding compared to traditional LLMs.
The metrics of tomorrow will need to capture not just accuracy, but also:
- Reasoning capability
- Ethical alignment
- Energy efficiency
- Robustness to adversarial inputs
- Fairness across different populations
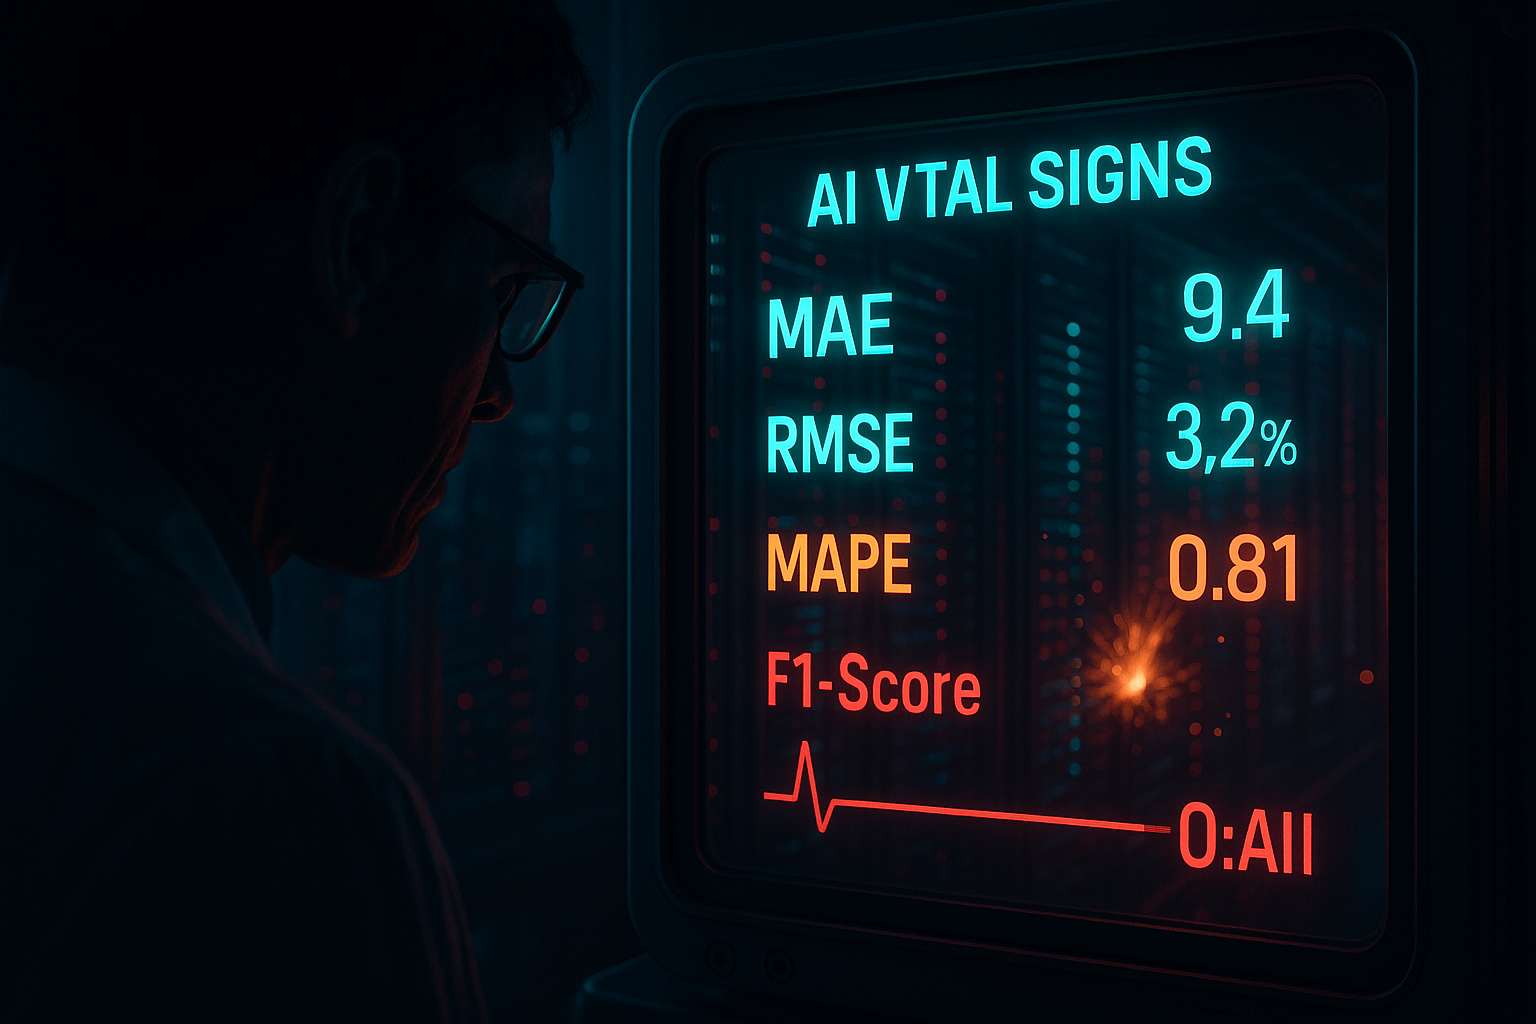
Fig. 4: Medical monitor displaying an AI system's 'vital signs'..
The bottom line
MAE, RMSE, and MAPE aren't just abstract numbers—they're the vital signs of your AI system. But like medical vital signs, they only tell part of the story. A healthy blood pressure doesn't mean you're in perfect health, and a low RMSE doesn't mean your model is ready for production.
The key is understanding what each metric reveals and conceals, then choosing the right combination for your specific use case. Because in the end, the best model isn't the one with the most impressive metrics—it's the one that solves real problems in the real world.
Next time someone shows you a model with 99% accuracy, remember the airplane navigation system. Ask not just how often it's right, but when it's wrong—and whether those failures happen at critical moments. Because in the real world, not all errors are created equal, and the metrics that matter most are the ones aligned with your actual goals.
The truth about AI's report card? It's only as good as the tests we design. And right now, we might be grading on the wrong curve entirely.
Related articles
Project Report: Symptomatic Alarm Pattern Discovery and Root Cause Analysis
A formal summary of Project ID a496e3ae-5149-4a15-86dd-a3aee47f493f. This report details the full execution of the project, from the analysis of 102,319 alarm records to the development of an analytical pipeline for anomaly detection and the strategic vision for future capabilities.

The Prognostics & RUL Cheat Sheet: A Guide for Real-World Assets
Ready to move from theory to reality with predictive maintenance? The first step is choosing the right RUL model—a choice that depends entirely on your data. This comprehensive cheat sheet demystifies the options, detailing four key methodologies.
Ready to get started with ML4Industry?
Discover how our machine learning solutions can help your business decode complex machine data and improve operational efficiency.
Get in touch