Predictive maintenance readiness checklist - is your data ready for machine learning?
A comprehensive framework to evaluate whether your industrial data is ready for machine learning implementation - avoid costly mistakes and focus your predictive maintenance efforts where they'll have the biggest impact.

Predictive maintenance readiness checklist: is your data ready for machine learning?
You've heard the stories. Companies reducing unplanned downtime by 40%. Maintenance costs slashed by millions. Equipment running longer, more efficiently, with fewer surprise failures. The promise of predictive maintenance powered by machine learning is compelling—but here's what no one talks about in those success stories: most predictive maintenance projects fail before they even begin.
Why? Because companies jump into complex ML algorithms without asking the fundamental question: "Is our data actually ready for machine learning?"
It's like trying to build a skyscraper on quicksand. You can have the most sophisticated engineering plans in the world, but without a solid foundation, everything crumbles.
I've seen this scenario play out countless times. A plant manager gets excited about AI, allocates budget for a predictive maintenance project, hires consultants, and six months later... nothing. The data is messy, incomplete, or simply doesn't contain the signals needed to predict failures.
But here's the good news: You can avoid this trap entirely.

Fig. 1: Comparison between data-ready smart factory and unprepared traditional manufacturing facility
Today, I'm going to walk you through a comprehensive checklist that will tell you definitively whether your data is ready for machine learning—before you waste time, money, and credibility on a project doomed to fail.
Why data readiness matters more than algorithm sophistication
Here's what I wish every industrial leader understood: The algorithm isn't the hard part. The data is.
You can have the most advanced machine learning models in the world, but if your data is garbage, your predictions will be garbage too. It's that simple.
Think about it this way: Machine learning algorithms are pattern recognition engines. They learn by examining historical examples of normal operation versus failure conditions. If your data doesn't clearly capture these patterns—if it's noisy, incomplete, or missing critical context—no amount of algorithmic sophistication will save you.
According to IBM's research on predictive maintenance implementations, companies that conduct thorough data readiness assessments before beginning ML projects are 3x more likely to achieve their expected ROI within the first year.
This is why at ML4Industry, we always start with a comprehensive data assessment before touching a single algorithm. It's not the exciting part, but it's the part that determines whether your project succeeds or becomes another cautionary tale.
The ML4Industry data readiness framework
Over the years, we've developed a systematic approach to evaluating data readiness for predictive maintenance. This framework has helped dozens of companies avoid costly mistakes and focus their efforts where they'll have the biggest impact.
The framework consists of four critical dimensions:
- Data Quality & Completeness
- Signal Richness & Relevance
- Historical Context & Failure Examples
- Infrastructure & Accessibility
Let's walk through each one with specific, actionable criteria you can evaluate today.
Dimension 1: Data quality & completeness
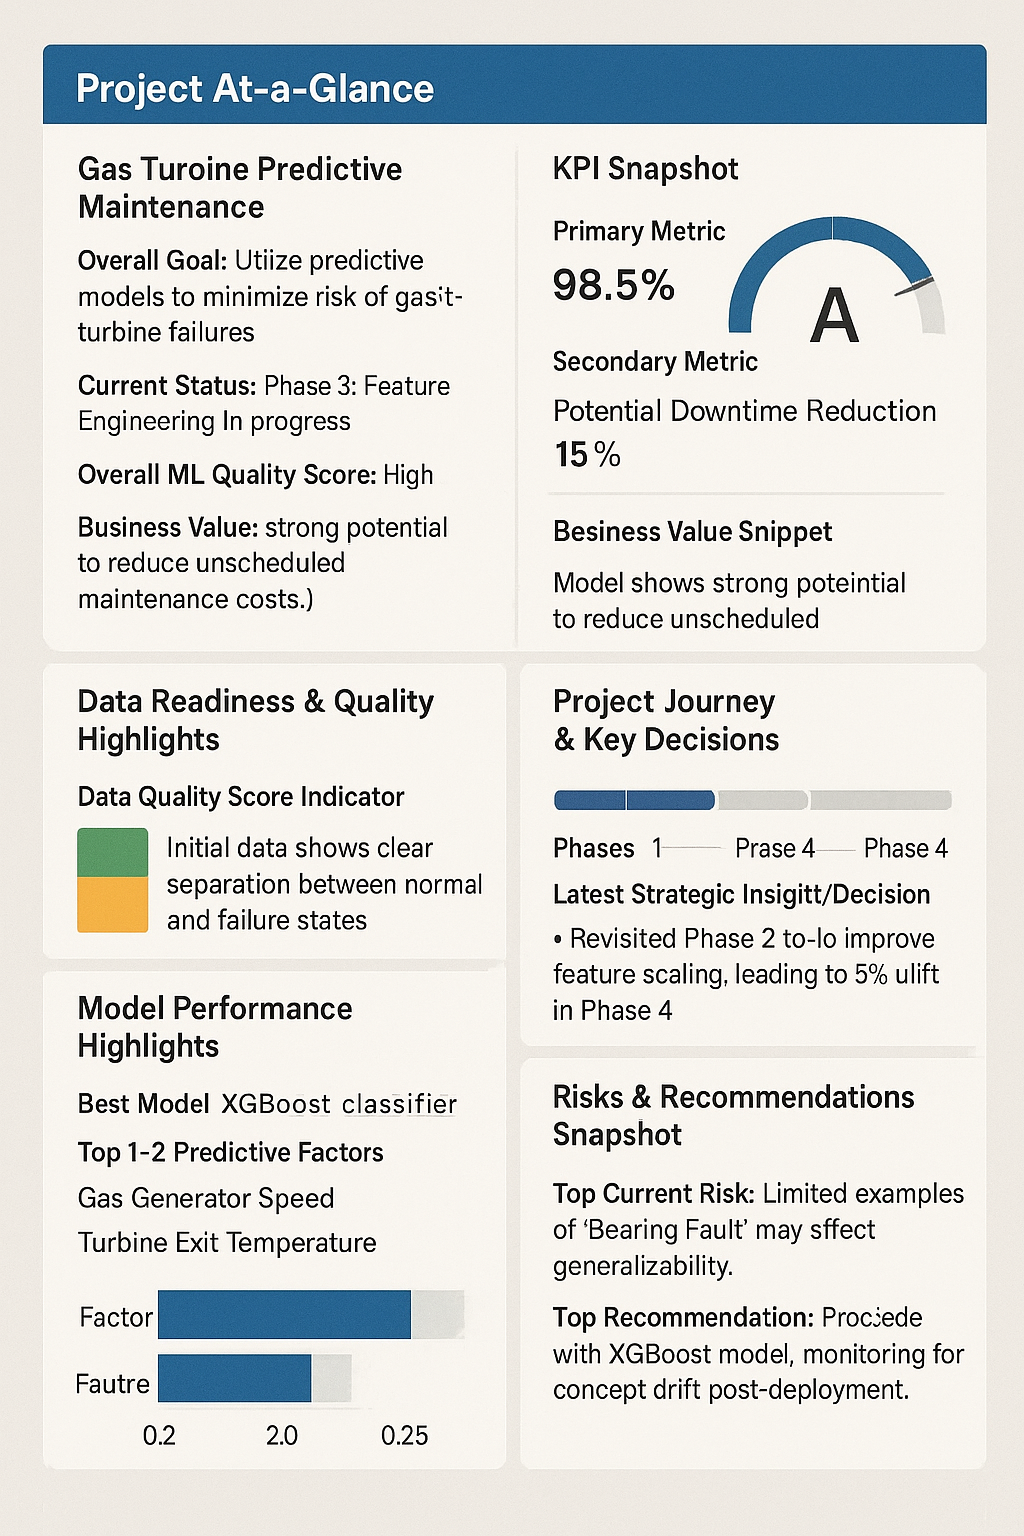
Fig. 2: Four-dimensional data readiness assessment framework for predictive maintenance
✅ Checklist items:
Data availability and coverage:
- [ ] You have at least 12-18 months of continuous sensor data
- [ ] Data covers at least 3-5 complete failure cycles (from installation to failure)
- [ ] Missing data points represent less than 15% of your total dataset
- [ ] You have data from both normal operations and known failure periods
Data consistency and reliability:
- [ ] Sensor timestamps are synchronized across all data sources
- [ ] Data collection frequency is consistent (no major gaps or irregular intervals)
- [ ] Units of measurement are standardized across similar sensors
- [ ] You can trace data lineage back to specific equipment and time periods
Data cleanliness:
- [ ] Obvious outliers and sensor malfunctions are identified and documented
- [ ] You have established normal operating ranges for each monitored parameter
- [ ] Duplicate or redundant measurements are removed or consolidated
- [ ] Data format is consistent (no mixing of different file types or schemas)
🚨 Red flags to watch for:
-
Sporadic data collection: If your data looks like Swiss cheese—full of holes where sensors went offline, maintenance teams forgot to record readings, or systems crashed—ML algorithms will struggle to find reliable patterns.
-
Sensor drift without calibration: Many industrial sensors gradually drift over time. If you haven't been calibrating regularly or accounting for this drift, your "normal" baseline is actually a moving target.
-
Multiple data formats: If your vibration data is in CSV files, temperature readings are in a proprietary SCADA format, and maintenance logs are in Excel spreadsheets, you're not ready. Data integration will eat up 70% of your project timeline.
Dimension 2: Signal richness & relevance
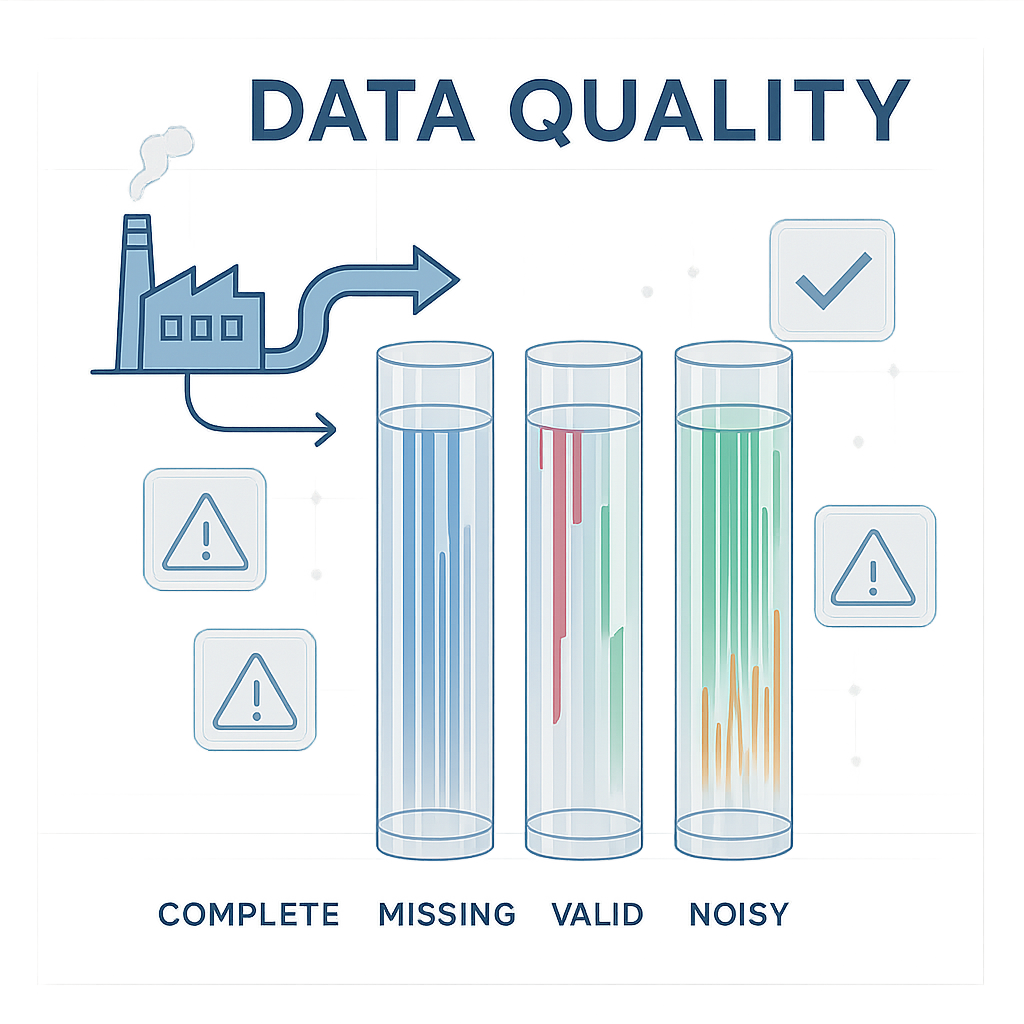
Fig. 3: Machine learning pattern recognition in industrial sensor data showing normal operation versus failure prediction
This is where we separate the wheat from the chaff. Not all sensor data is created equal when it comes to predicting failures.
✅ Checklist items:
Sensor coverage and diversity:
- [ ] You monitor multiple failure modes (bearing wear, lubrication issues, electrical faults, etc.)
- [ ] Sensors capture both slow degradation (temperature trends) and fast events (vibration spikes)
- [ ] You have both direct measurements (bearing temperature) and indirect indicators (motor current signature)
- [ ] Environmental factors are captured (ambient temperature, humidity, load conditions)
Signal quality and resolution:
- [ ] Data sampling frequency is appropriate for failure modes (high-frequency for vibration, lower for temperature trends)
- [ ] Sensor resolution can detect meaningful changes (not just gross failures)
- [ ] Signal-to-noise ratio is adequate for pattern detection
- [ ] You capture both steady-state and transient operating conditions
Domain relevance:
- [ ] Monitored parameters have known physical relationships to failure modes
- [ ] You're measuring leading indicators, not just lagging indicators
- [ ] Data includes operational context (load levels, operating hours, duty cycles)
- [ ] Maintenance actions and their timing are recorded alongside sensor data
💡 Pro tip: The golden question
Ask yourself: "If I were an experienced maintenance technician, could I look at this data and have a reasonable chance of predicting when equipment might fail?"
If the answer is no, machine learning probably can't do it either. ML amplifies patterns that exist in data—it doesn't create patterns from nothing.
Dimension 3: Historical context & failure examples
Here's where many predictive maintenance projects hit their first major roadblock: You need examples of failures to learn from.
Machine learning for predictive maintenance is fundamentally supervised learning. The algorithm needs to see examples of equipment degrading toward failure to learn what "heading toward failure" looks like.
✅ Checklist items:
Failure documentation:
- [ ] You have documented at least 5-10 failure events for similar equipment
- [ ] Failure modes are categorized and consistently labeled
- [ ] Time-to-failure is recorded (when degradation started, when failure occurred)
- [ ] Root cause analysis was performed for major failures
Degradation patterns:
- [ ] You can identify gradual degradation periods (weeks to months before failure)
- [ ] Sudden failure events are distinguished from gradual deterioration
- [ ] Operating conditions during degradation periods are documented
- [ ] Maintenance interventions and their impact on degradation are recorded
Operational context:
- [ ] Equipment age, maintenance history, and operational hours are tracked
- [ ] Environmental conditions during failure periods are documented
- [ ] Load profiles and duty cycles leading up to failures are captured
- [ ] Similar equipment with different failure patterns can be compared
🎯 Real-world example:
One of our clients, a steel manufacturer, thought they had great data for predicting conveyor belt failures. They had years of motor current measurements, belt tension readings, and vibration data.
But when we dug deeper, we discovered a problem: They had excellent documentation of when belts failed, but zero documentation of what the data looked like in the weeks and months before failure. Their maintenance team was so good at reactive maintenance that they replaced belts immediately after failure, without capturing the degradation patterns.
Research from MIT on predictive maintenance success factors shows that companies with comprehensive failure documentation achieve 60% better prediction accuracy than those relying solely on sensor data without context.
We had to run the system for another 8 months, deliberately allowing some belts to degrade (under careful monitoring) to capture those critical pre-failure patterns. Only then could we build effective ML models.
Dimension 4: Infrastructure & accessibility
Even perfect data is useless if you can't access it, process it, or integrate it into your operations.
✅ Checklist items:
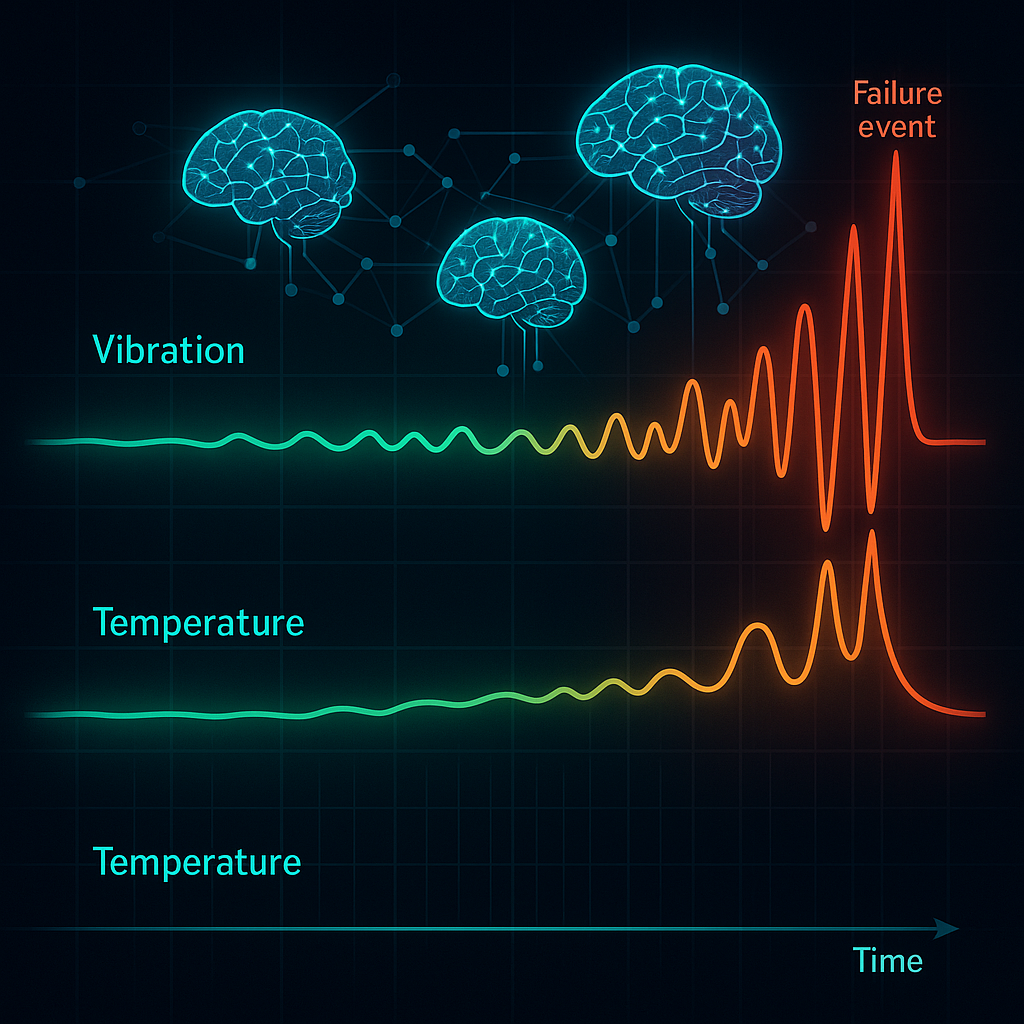
Fig. 4: "Three-phase implementation roadmap for predictive maintenance readiness
Data accessibility:
- [ ] Data can be exported in standard formats (CSV, JSON, database exports)
- [ ] You have programmatic access to data (APIs, database connections, automated exports)
- [ ] Historical data doesn't require manual intervention to retrieve
- [ ] Real-time data streams are available for live monitoring
Processing capabilities:
- [ ] Your IT infrastructure can handle the data volumes involved
- [ ] You have tools or capability to perform basic data analysis and visualization
- [ ] Computing resources are available for model training and inference
- [ ] Data security and access controls are defined and manageable
Integration readiness:
- [ ] Predictive outputs can be integrated into existing maintenance workflows
- [ ] Decision-makers have access to model results in actionable formats
- [ ] Alert systems and dashboards can be configured
- [ ] Model updates and retraining processes can be implemented
How to conduct your data readiness assessment
Now that you understand what to look for, here's how to systematically evaluate your data:
Step 1: Inventory your data sources
Create a comprehensive list of all data sources related to the equipment you want to monitor. Include:
- Sensor types and locations
- Data collection frequency and format
- Historical availability (how far back does it go?)
- Current accessibility and export options
Step 2: Evaluate data quality
Take a representative sample of your data (last 3-6 months) and run it through the quality checklist above. Look for:
- Gaps and missing values
- Obvious errors or outliers
- Inconsistent formats or units
- Timestamp alignment issues
Step 3: Map failure examples
Document every failure event you can find for your target equipment. For each failure:
- When did it occur?
- What was the root cause?
- What sensor readings looked like in the weeks/months before failure?
- What operational conditions were present?
Step 4: Assess signal-to-failure relationships
This is the critical test: Can you see patterns in your sensor data that correlate with known failures?
Plot your key sensor measurements over time and mark failure events. Do you see:
- Gradual trends leading up to failures?
- Sudden changes that preceded failures?
- Clear differences between normal and pre-failure periods?
If you don't see obvious patterns by eye, ML probably won't find them either.
What to do if your data isn't ready (yet)
Don't panic if your data doesn't pass all these checks. Most companies have work to do before they're truly ML-ready. Here's how to prioritize your improvements:
If you fail on data quality (Dimension 1):
Priority: HIGH Focus on improving data collection consistency and completeness. This might mean:
- Upgrading sensor networks
- Implementing better data management systems
- Establishing data governance procedures
- Training teams on consistent data collection
If you fail on signal richness (Dimension 2):
Priority: MEDIUM You may need additional sensors or different measurement approaches. Consider:
- Conducting a sensor gap analysis
- Installing additional monitoring equipment
- Exploring alternative measurement techniques
- Consulting with domain experts on what to measure
If you fail on historical context (Dimension 3):
Priority: VARIABLE This depends on your failure frequency. If equipment fails regularly, you can start collecting this data now. If failures are rare, you might need to:
- Implement run-to-failure protocols for some equipment
- Look for similar equipment data from other sites
- Start with condition monitoring rather than failure prediction
- Focus on detecting anomalies rather than predicting specific failures
If you fail on infrastructure (Dimension 4):
Priority: MEDIUM Infrastructure problems are solvable but require investment. Options include:
- Upgrading IT systems and data management capabilities
- Implementing cloud-based data processing solutions
- Partnering with technology providers who can handle data processing
- Starting with smaller, pilot implementations
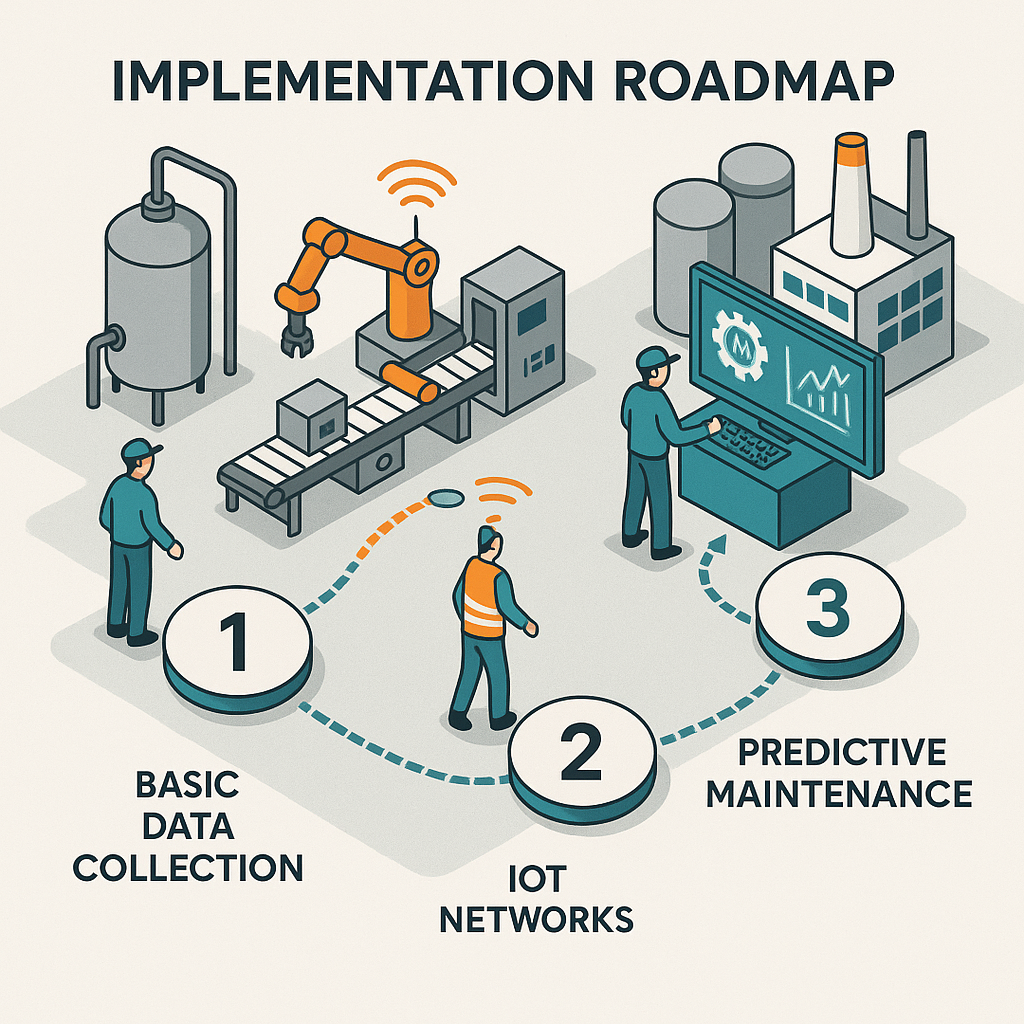
Fig. 5: "Three-phase implementation roadmap for predictive maintenance readiness
The path forward: building ML readiness step by step
Remember, you don't need perfect data to start getting value from machine learning. You need adequate data that meets the minimum requirements for your specific use case.
Here's a practical roadmap:
Phase 1: Foundation building (3-6 months)
- Conduct comprehensive data audit using this checklist
- Address critical data quality issues
- Begin systematic failure documentation
- Establish data governance procedures
Phase 2: Pilot implementation (6-12 months)
- Select 1-2 pieces of equipment with the best data
- Implement basic condition monitoring
- Start collecting pre-failure pattern data
- Build internal ML capabilities or partner selection
Phase 3: Expansion and optimization (12+ months)
- Scale successful approaches to additional equipment
- Implement full predictive maintenance workflows
- Continuously improve models with new data
- Expand to additional failure modes and equipment types
Your next steps
The difference between predictive maintenance success and failure often comes down to this initial assessment. Companies that take the time to honestly evaluate their data readiness before diving into ML projects save months of frustration and thousands of dollars in wasted effort.
Take action today:
-
Download our complete data readiness assessment template (includes detailed scoring criteria and improvement recommendations)
-
Conduct a pilot assessment on one critical piece of equipment using the checklist above
-
Identify your biggest data gaps and create an improvement plan
-
Consider a professional data readiness assessment if you want expert guidance on your specific situation
According to research from Google's industrial AI team, companies that complete thorough data readiness assessments before beginning ML projects are 4x more likely to achieve production deployment within 18 months.
The promise of predictive maintenance is real. The technology works. But it only works when you have the right foundation in place.
Is your data ready? There's only one way to find out.
Ready to take the next step? ML4Industry's Predictive Maintenance Readiness Assessment provides a comprehensive evaluation of your data, infrastructure, and organizational readiness for successful ML implementation. Our expert team will analyze your specific situation and provide a detailed roadmap for moving forward. Contact us today to discuss your predictive maintenance goals.
Related articles
Project Report: Symptomatic Alarm Pattern Discovery and Root Cause Analysis
A formal summary of Project ID a496e3ae-5149-4a15-86dd-a3aee47f493f. This report details the full execution of the project, from the analysis of 102,319 alarm records to the development of an analytical pipeline for anomaly detection and the strategic vision for future capabilities.

The Prognostics & RUL Cheat Sheet: A Guide for Real-World Assets
Ready to move from theory to reality with predictive maintenance? The first step is choosing the right RUL model—a choice that depends entirely on your data. This comprehensive cheat sheet demystifies the options, detailing four key methodologies.
Ready to get started with ML4Industry?
Discover how our machine learning solutions can help your business decode complex machine data and improve operational efficiency.
Get in touch