From an Avalanche of Alerts to a Dialogue of Diagnosis: The C101 Compressor Story
We analyzed over 242,000 sensor records from a critical compressor, transforming a constant stream of noisy alerts into a clear, diagnostic language. This is the story of how we used machine learning to discover the hidden 'fingerprints' of inefficiency and failure, creating a data-driven roadmap to proactive maintenance and quantifiable business impact.

For decades, the most critical assets at an Industrial company, like the compressor C101, have generated millions of signals daily. Historically, these signals have been treated as a cascade of noisy, disconnected alarms, forcing personnel into a constant state of reactive fire-fighting. This pilot project was founded on a revolutionary premise: to translate that noise into a clear, diagnostic language.
By analyzing over 242,000 sensor records, we developed an automated machine learning pipeline that established a baseline for healthy equipment operation. This enabled it to detect and, crucially, categorize deviations into distinct, recurring patterns or "fingerprints." The outcome is a 24/7 monitoring capability that transforms abstract alerts into actionable, data-defined events, providing a powerful foundation for reducing unplanned downtime and improving maintenance efficiency.
This is the story of that pilot—a journey from raw data to a "Data X-Ray," from abstract alerts to actionable "Anomaly Fingerprints," and finally, to a clear quantification of business impact. It’s a blueprint for how to listen to what your equipment is trying to tell you.
Our Analytical Approach: A Disciplined Methodology
To ensure the findings of this pilot are both robust and repeatable, we employed a structured, multi-phase methodology grounded in industry best practices like CRISP-DM and ISO 13374 for machine diagnostics. Our approach is not a linear process, but an iterative cycle of discovery and validation, orchestrating human expertise with intelligent automation to transform raw data into strategic outcomes.
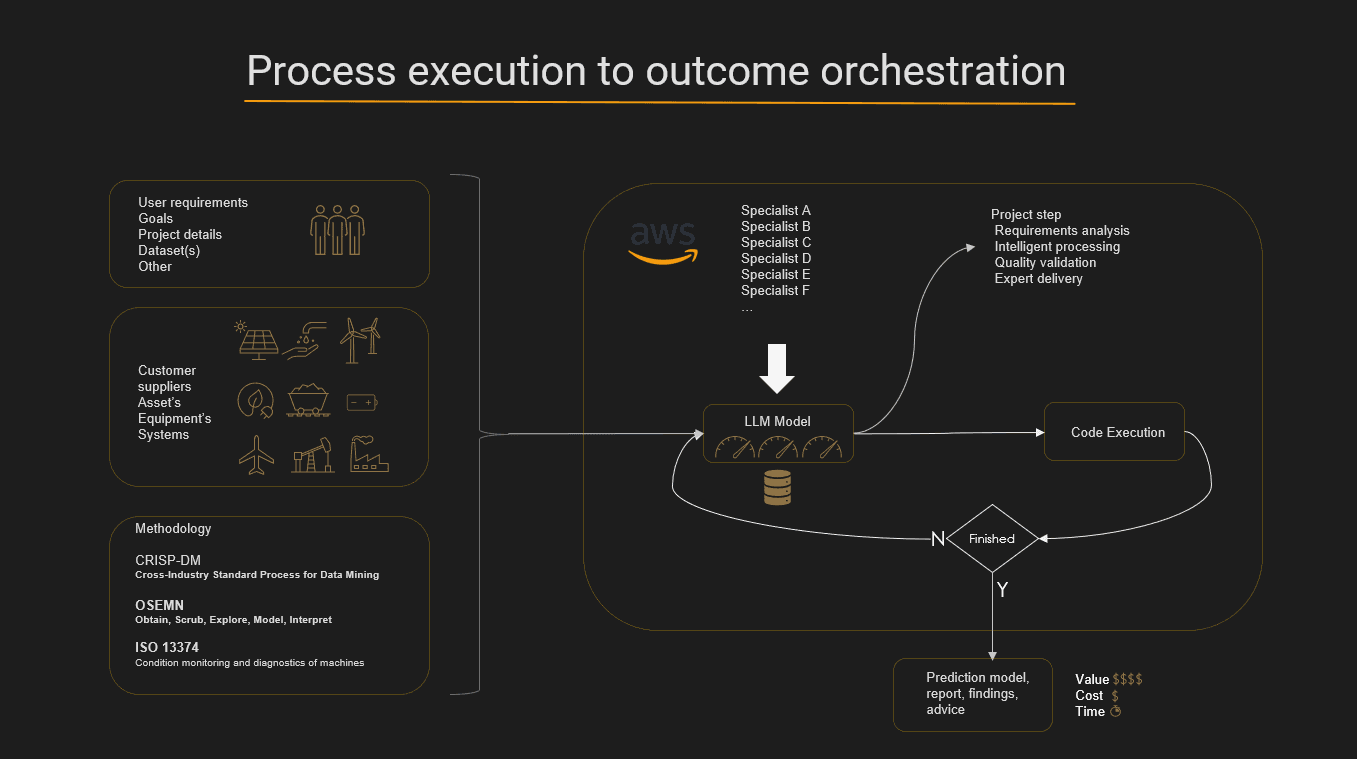
Our process can be summarized in three core phases:
- Understand the Data & Establish a Baseline: We immerse ourselves in the data, structuring it and performing exploratory analysis (EDA) to establish a statistically sound baseline of what "normal" or healthy operation looks like.
- Analyze Findings & Discover Patterns: With a health baseline established, machine learning models detect deviations (anomalies), which are then analyzed using clustering algorithms to uncover hidden, recurring patterns of behavior—the "fingerprints" of potential issues.
- Explore Further & Quantify Business Impact: We translate technical findings into business context, exploring the impact of patterns on operational performance. By defining peak performance benchmarks, we quantify the financial cost of deviations, turning data points into a clear business case.
Understanding the Asset and Its Data
The C101 is a multi-stage centrifugal compressor, a highly complex asset critical to plant operations. Its operation involves air intake, multi-stage compression, and cooling, all driven by a powerful 700 kW electric motor.
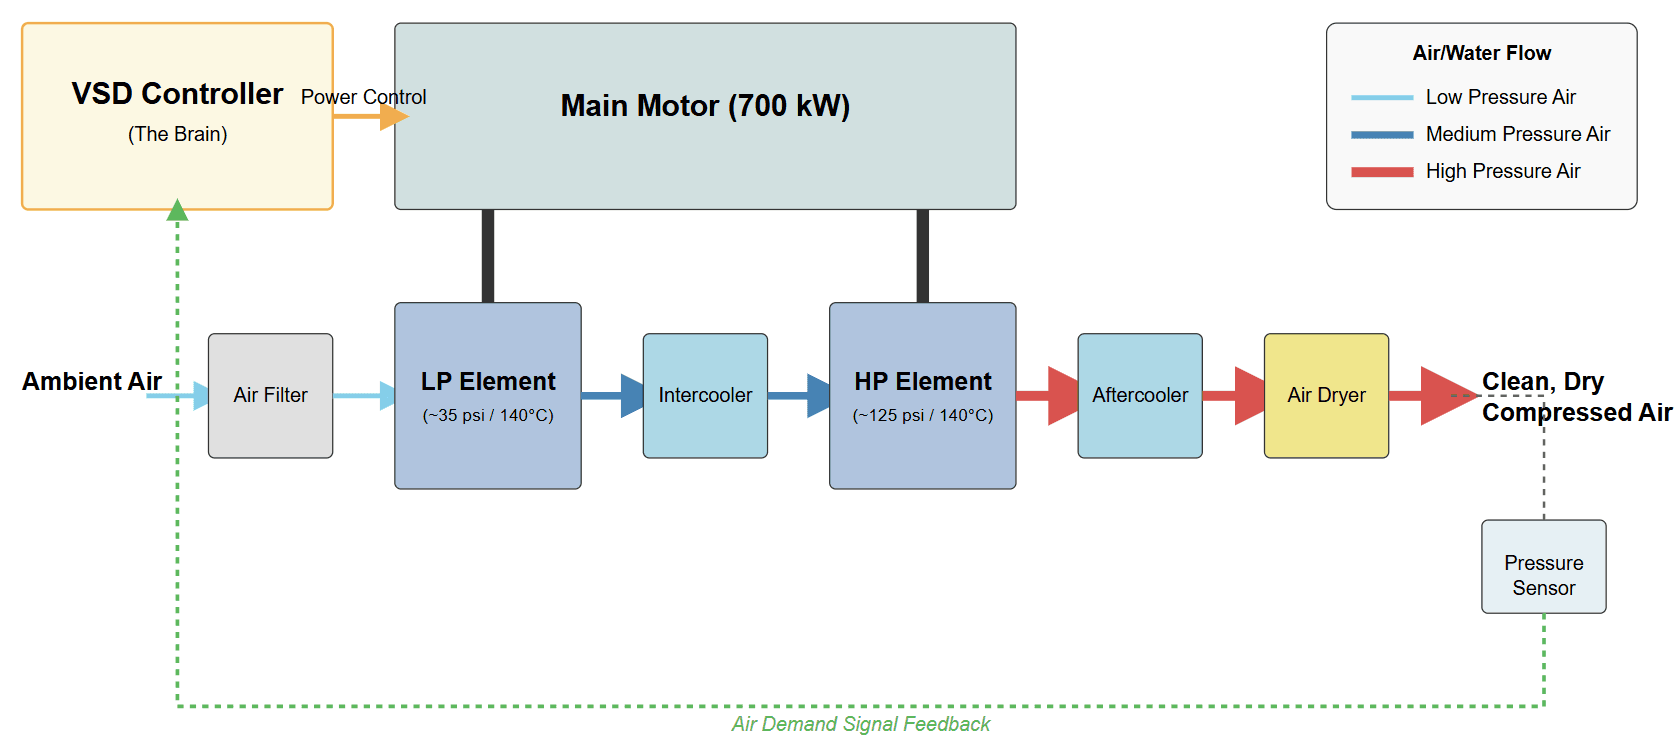
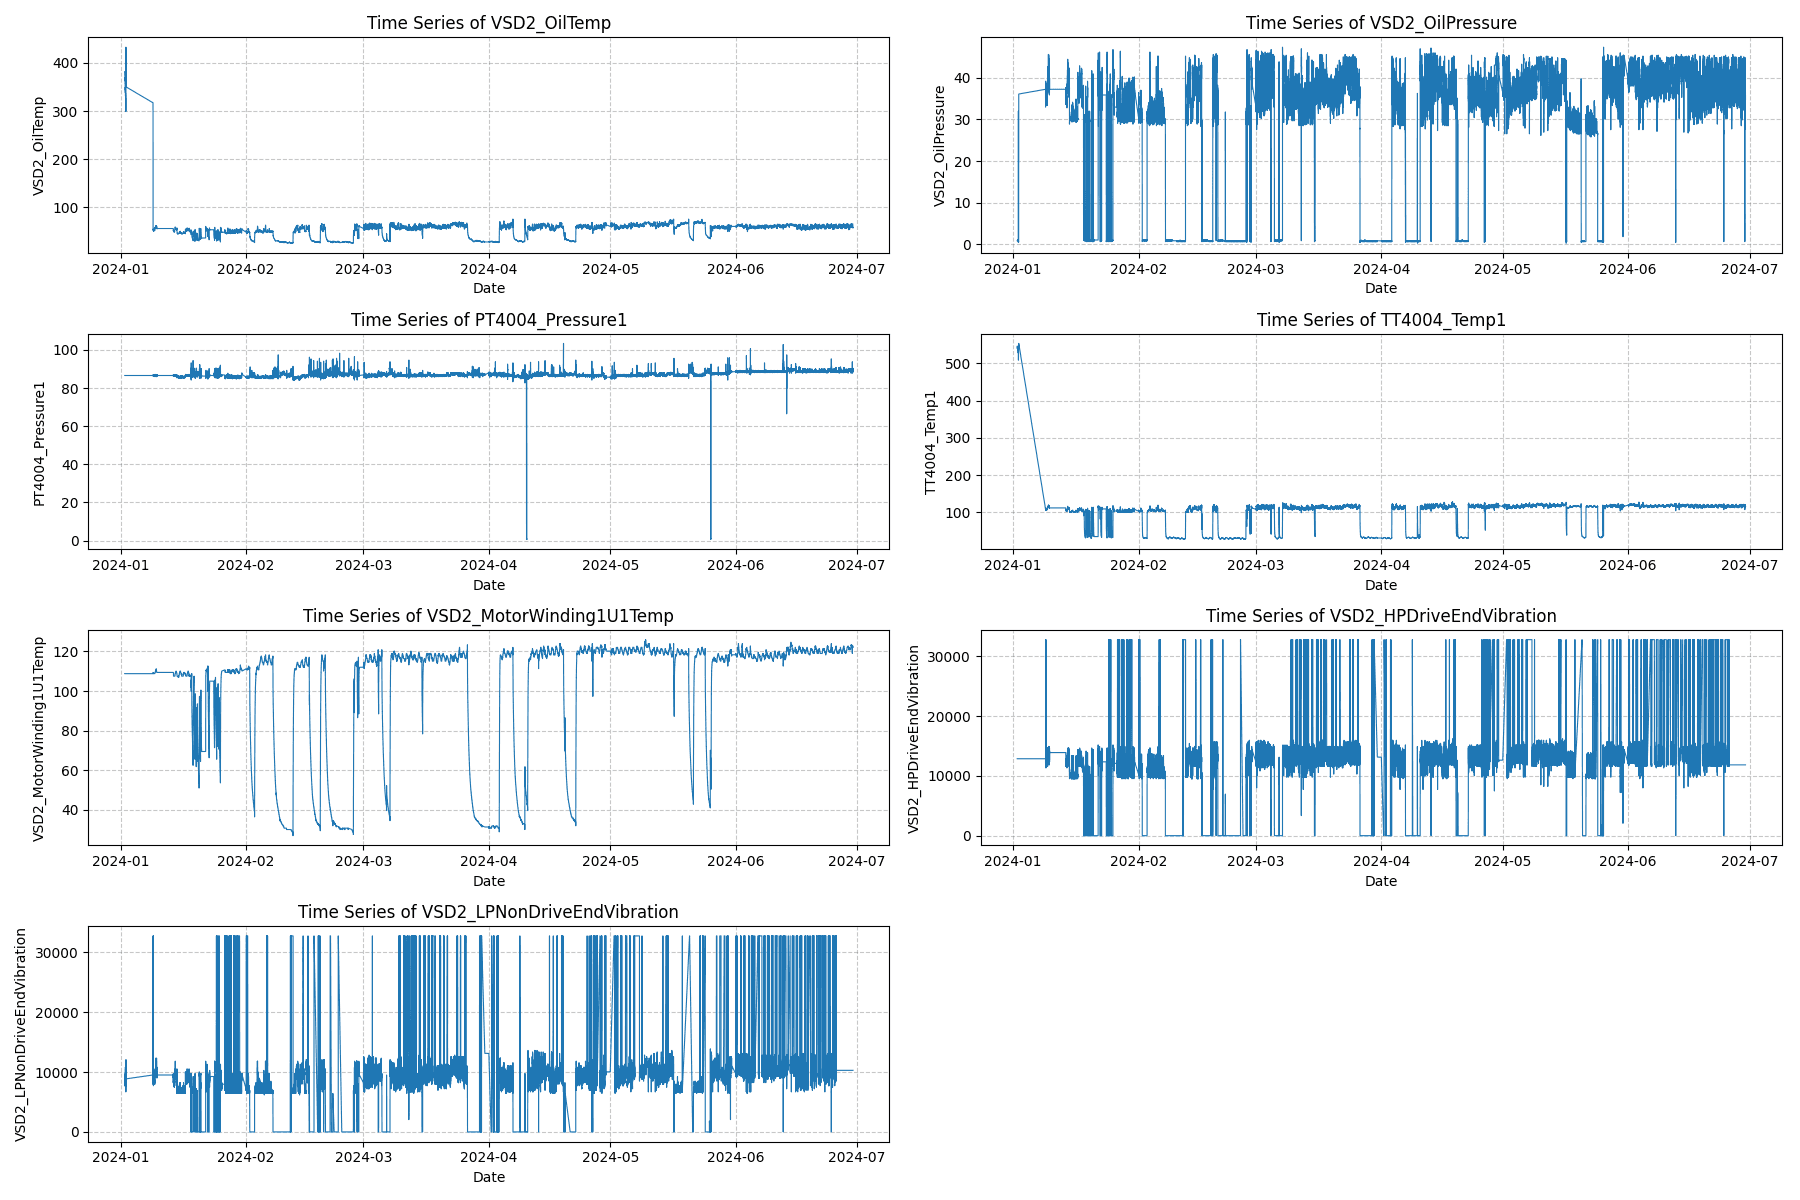
The foundation of this analysis is the time-series data collected from a network of sensors across the compressor. This raw data, representing hundreds of thousands of operational moments, captures the dynamic behavior of the asset.
The Diagnostic Journey: From Raw Data to a "Data X-Ray"
Our journey began by creating a "Data X-Ray" of all 45 sensors to understand their interrelationships. This comprehensive correlation analysis immediately highlighted large blocks of red in the heatmap, indicating that many sensors were highly correlated—essentially telling the same story. This insight was crucial, as it allowed us to intelligently reduce the number of features from 45 to a core set of "vital signs" without losing critical information, making our models more efficient and robust.
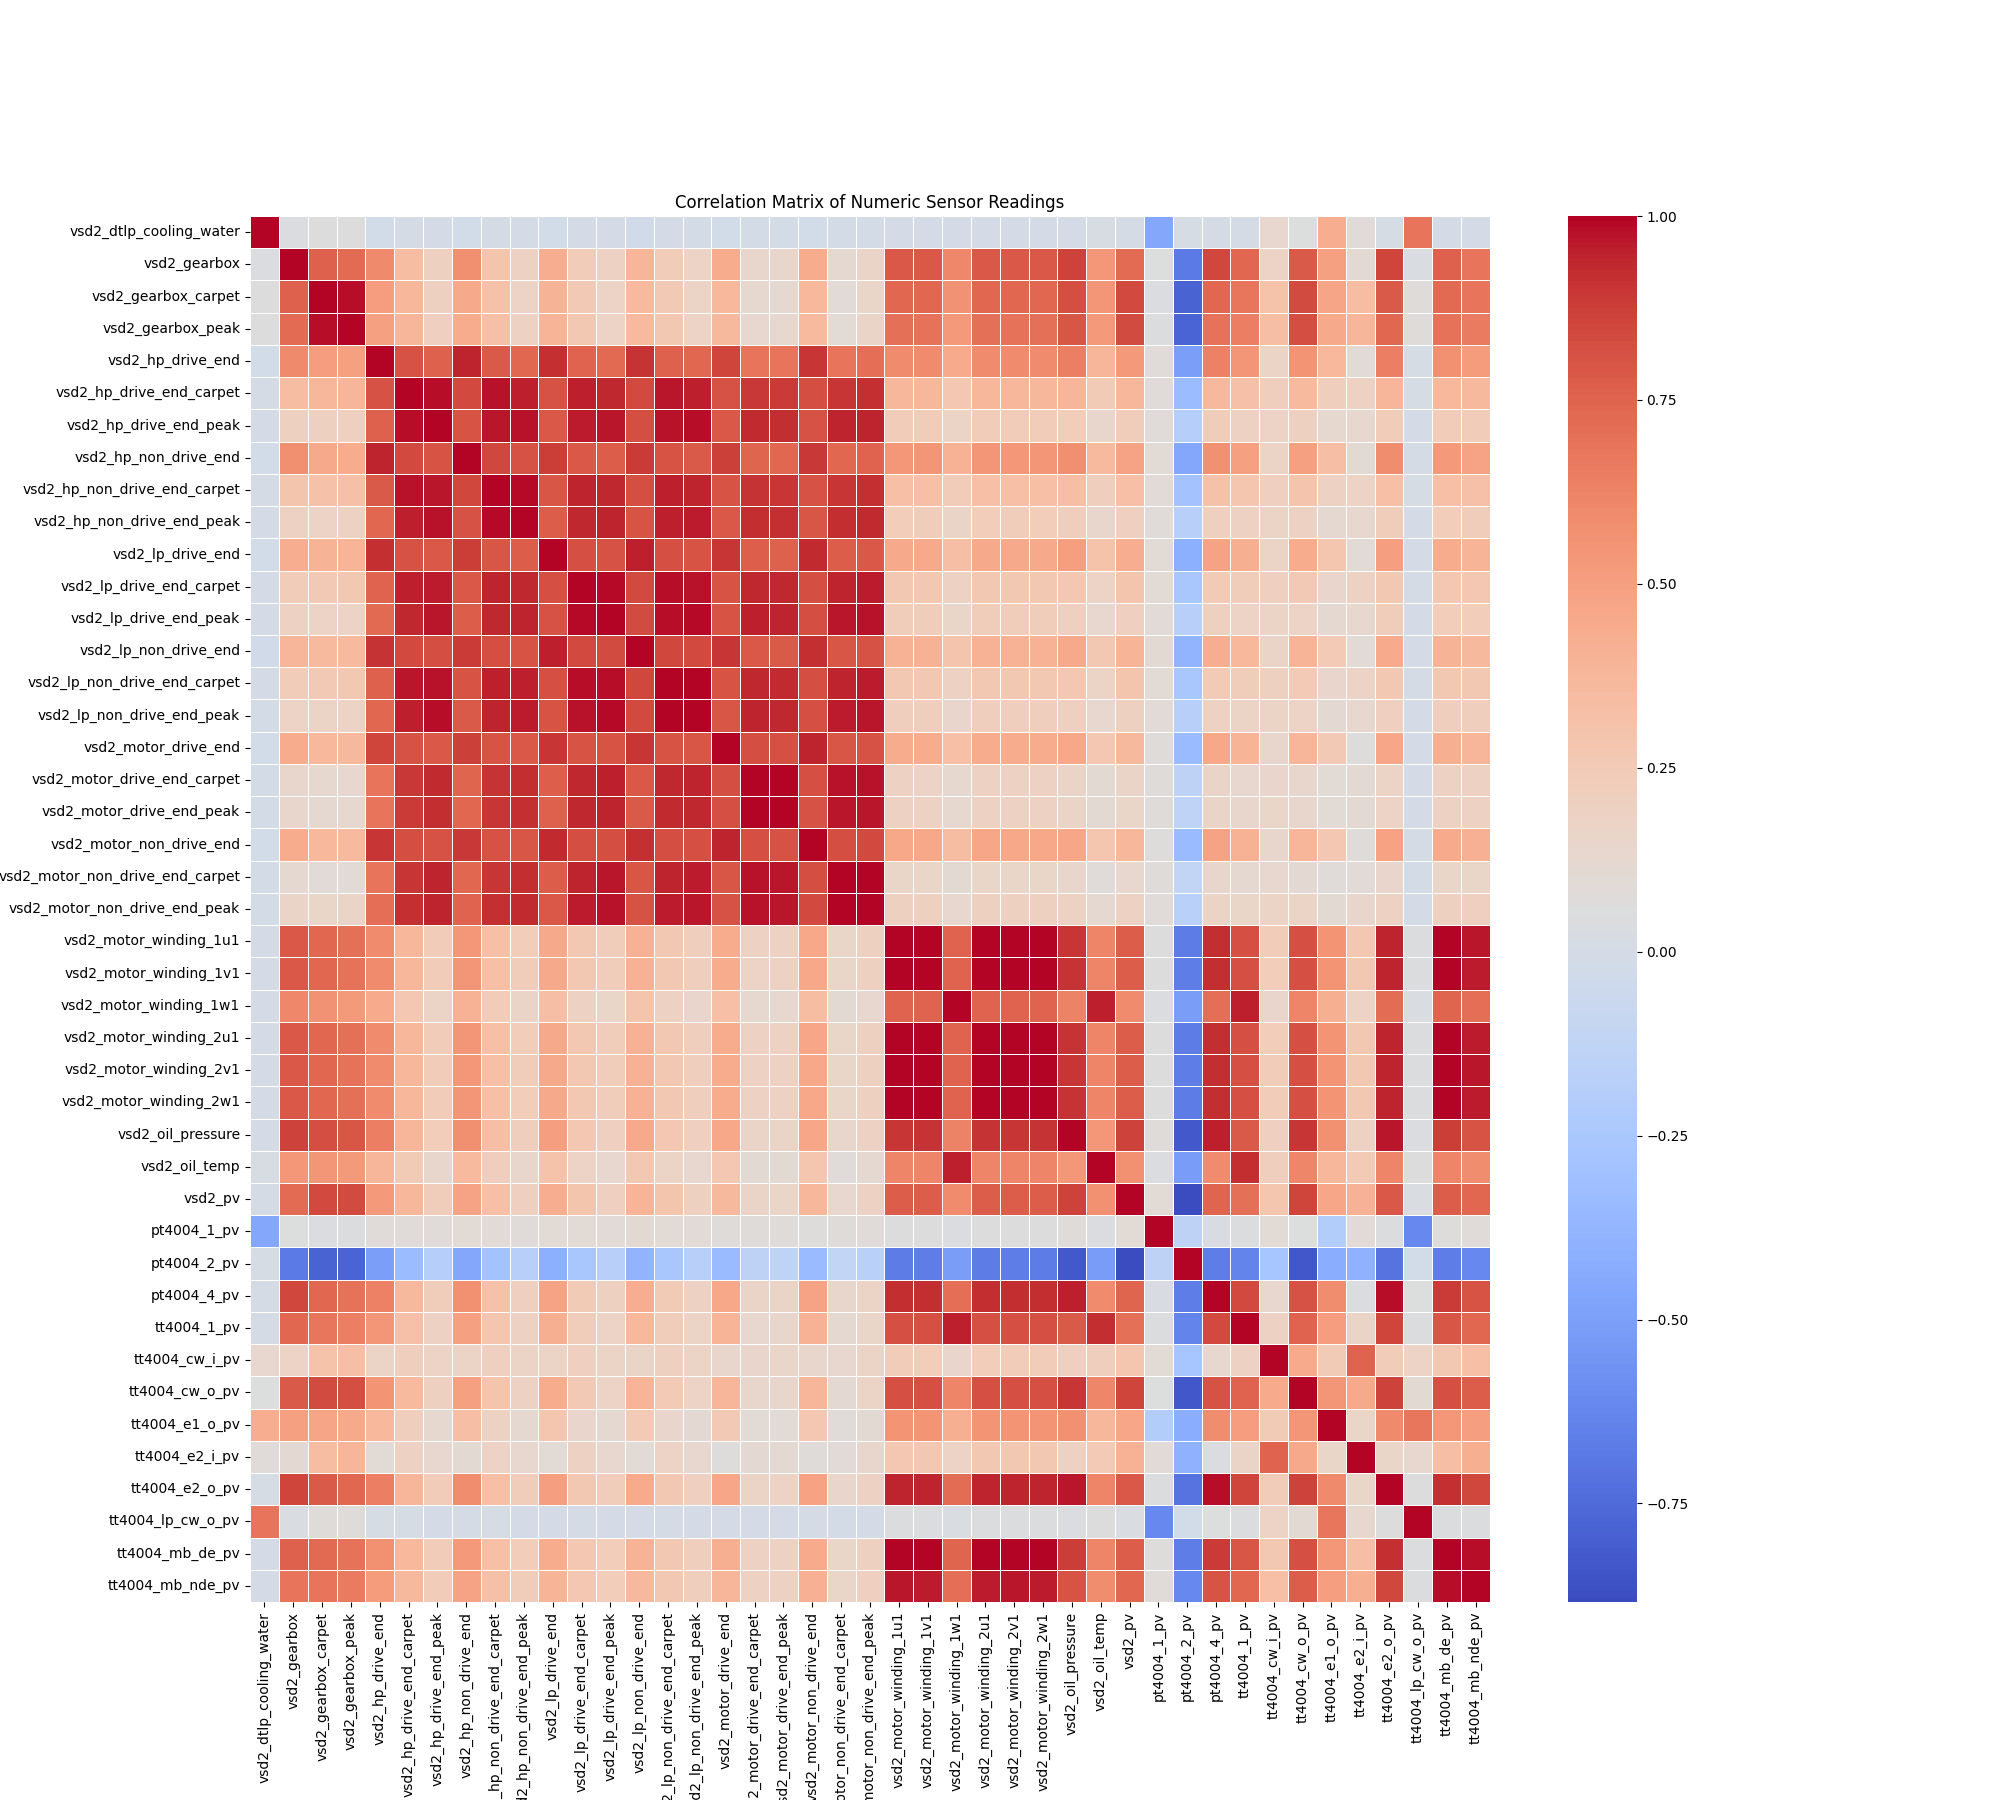
The most strategic insight came from the blue squares, which signify a negative correlation.
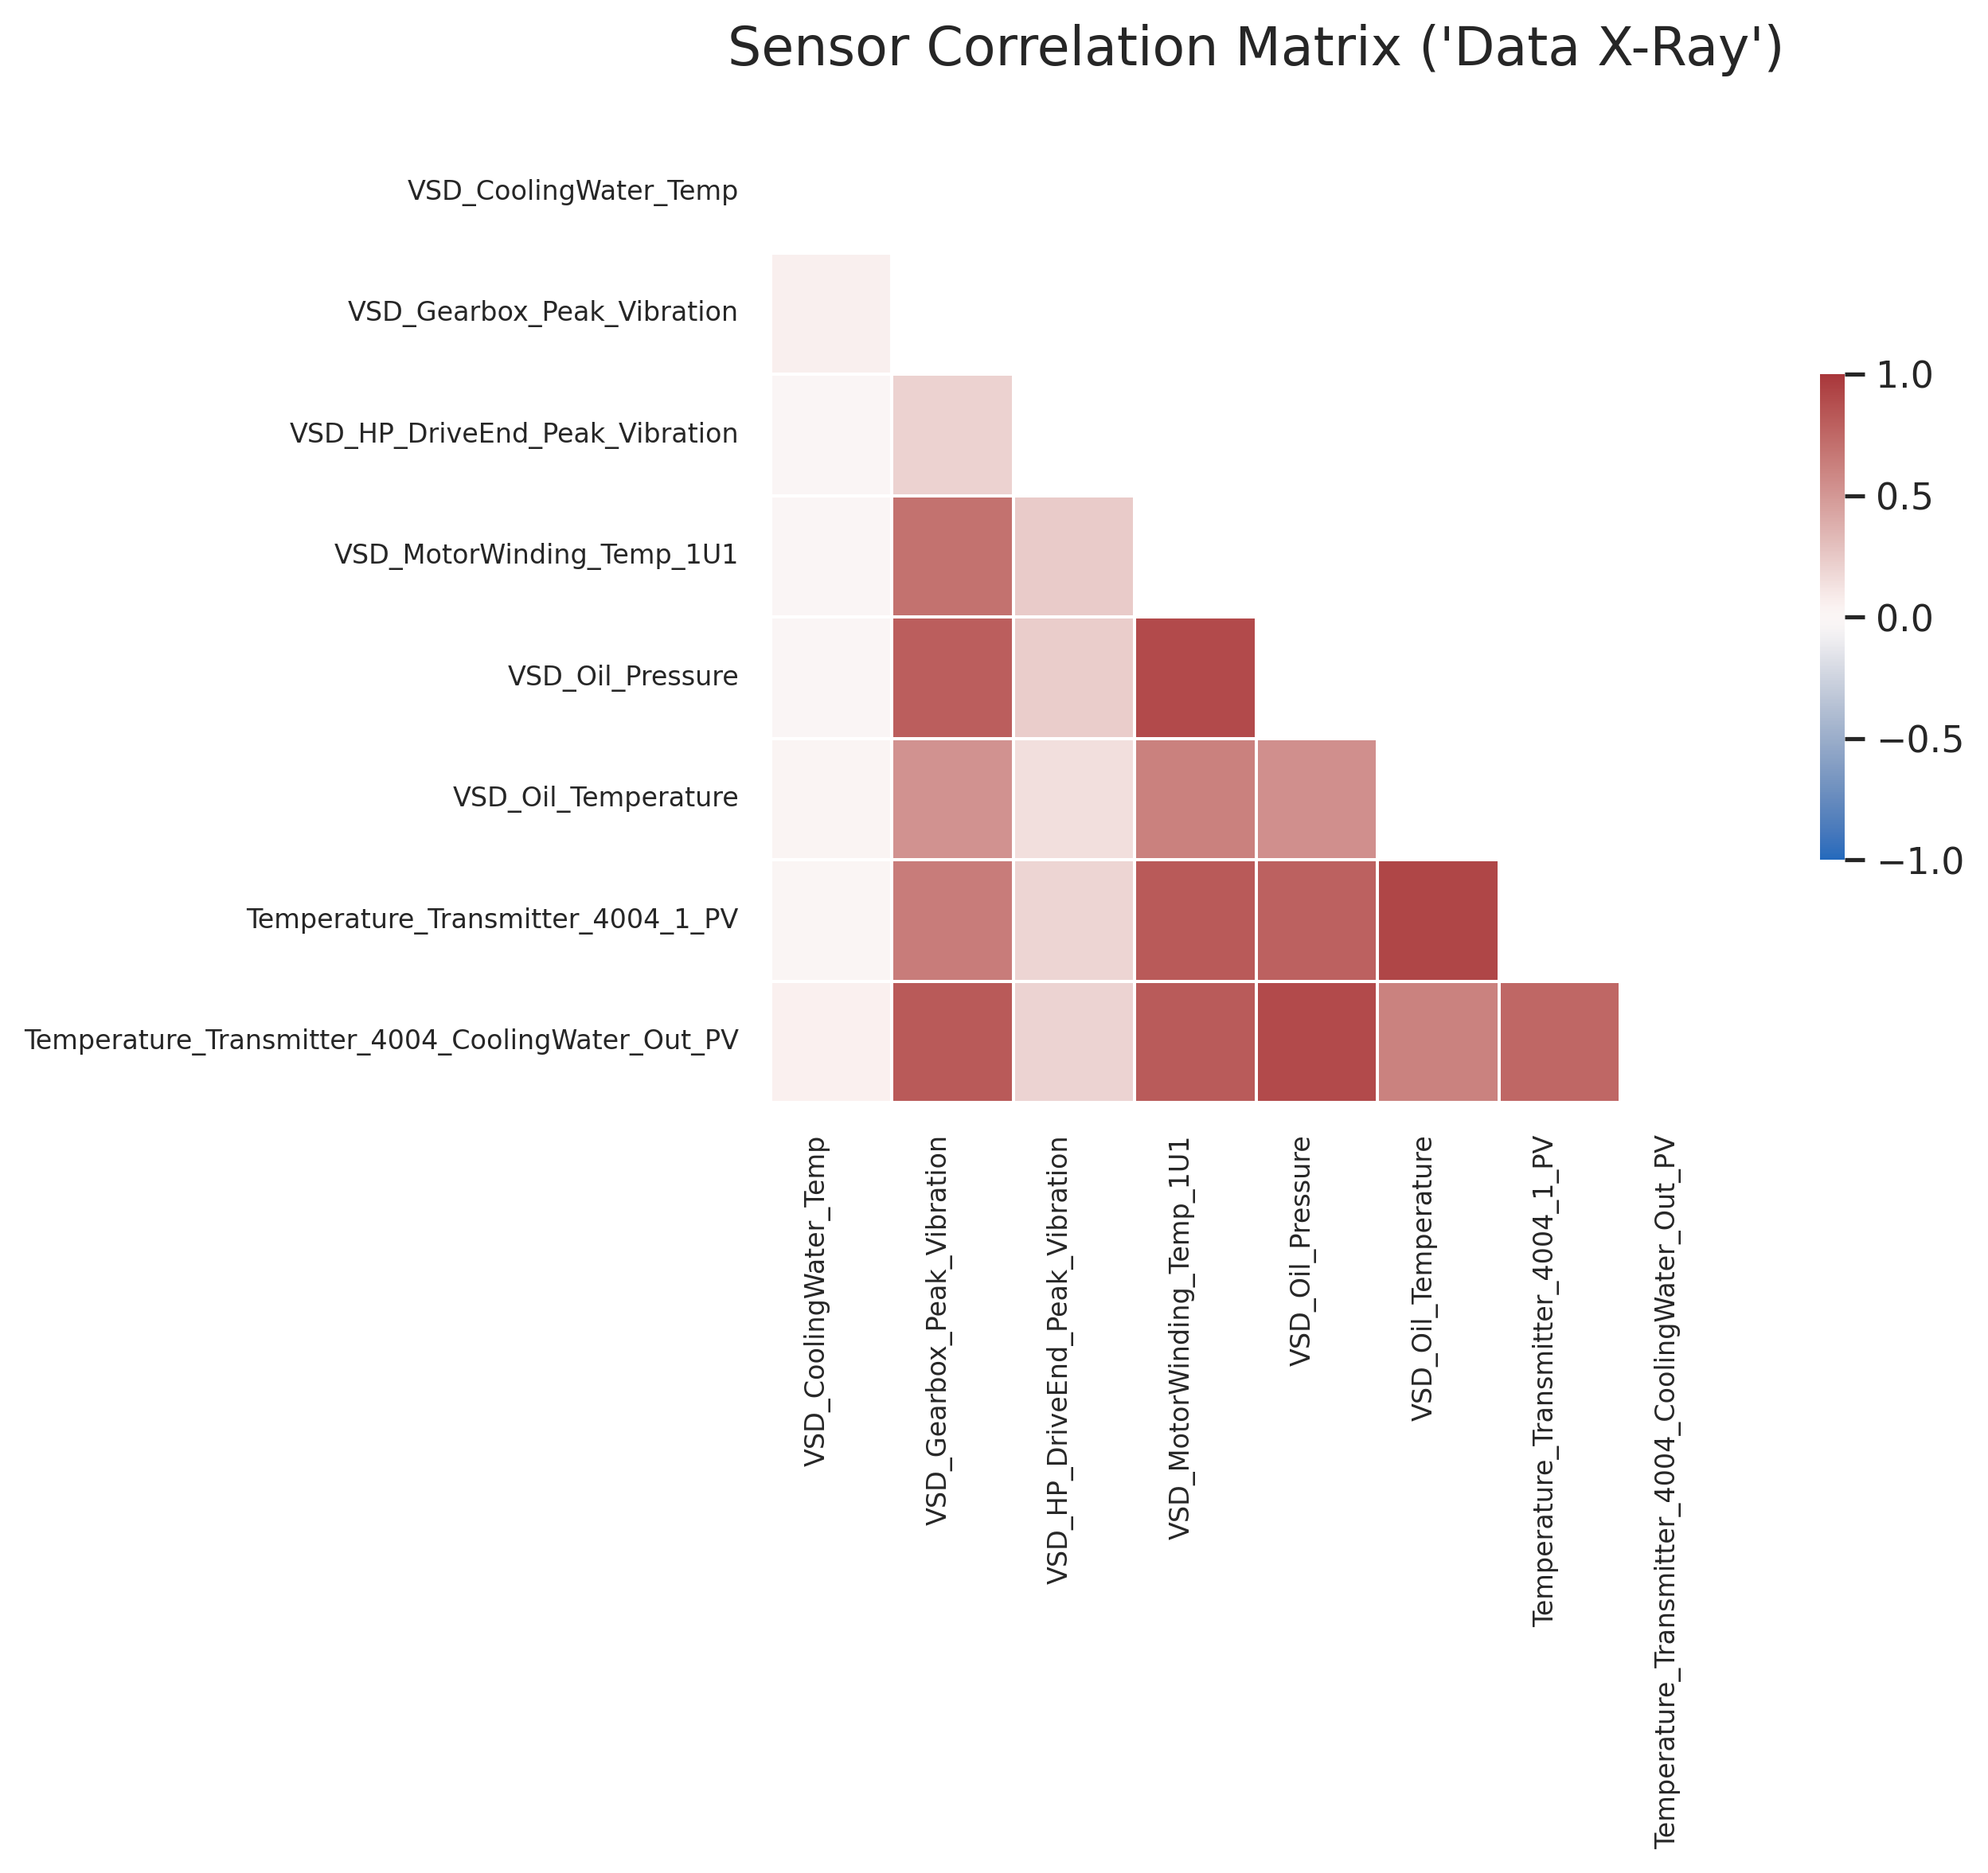
Exhibit 2a: The blue areas visually confirm that as stress indicators (like temperature and vibration) go up, productive output (pressure) goes down.
These blue squares revealed a powerful, recurring pattern—the data-driven signature of inefficiency:
When the compressor's internal stress (vibration, temperature) goes UP, its productive output (process pressure) goes DOWN.
It's analogous to a car engine that is overheating and rattling loudly but struggling to accelerate—it is working hard but failing to produce results. This inverse relationship is a clear, unambiguous leading indicator of a degrading system.
The Breakthrough: From Anomaly Alerts to Diagnostic Fingerprints
With this foundational understanding, our machine learning models learned the signature of healthy C101 operation. We built an "Equipment Health Monitor" that generates a continuous "anomaly score." When this score crosses a statistically determined threshold, it signals that the equipment is behaving abnormally.
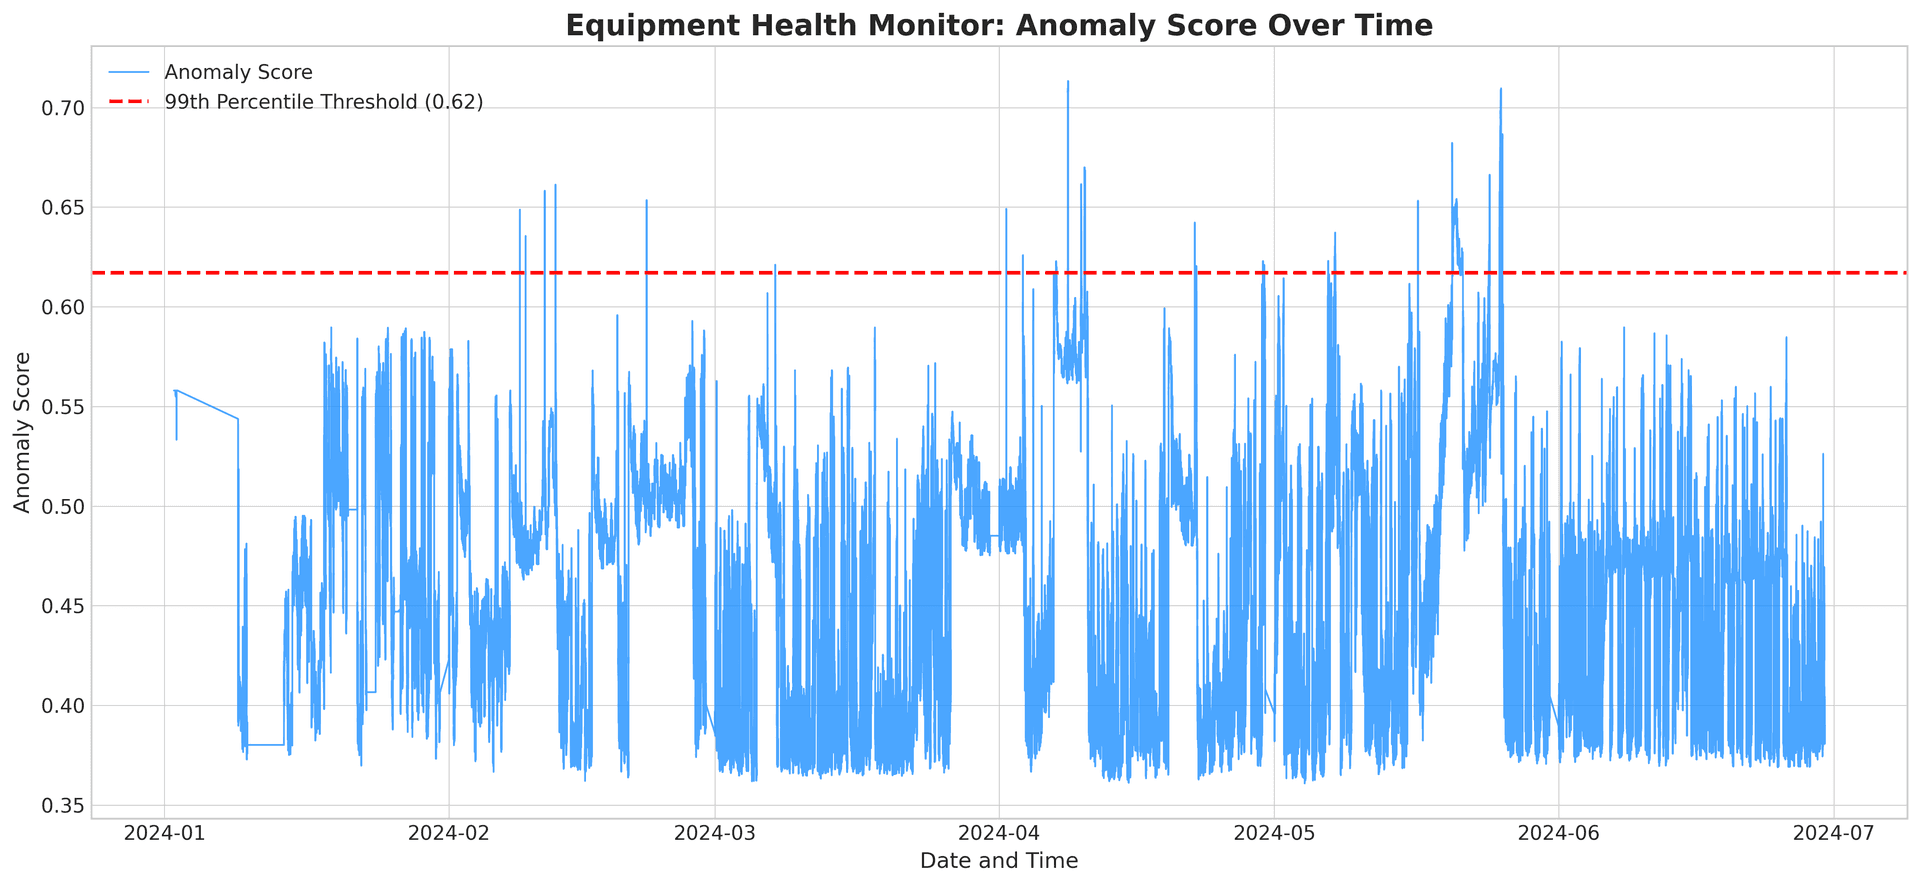
But an alert that says "something is wrong" isn't an answer. The real breakthrough came when we analyzed all the flagged anomalies together. The system automatically discovered they weren't random; they clustered into three distinct, recurring "Anomaly Fingerprints."
We rigorously validated these patterns using a silhouette analysis, which confirmed with a high score of 0.86 that these fingerprints represent meaningful and distinct operational signatures.
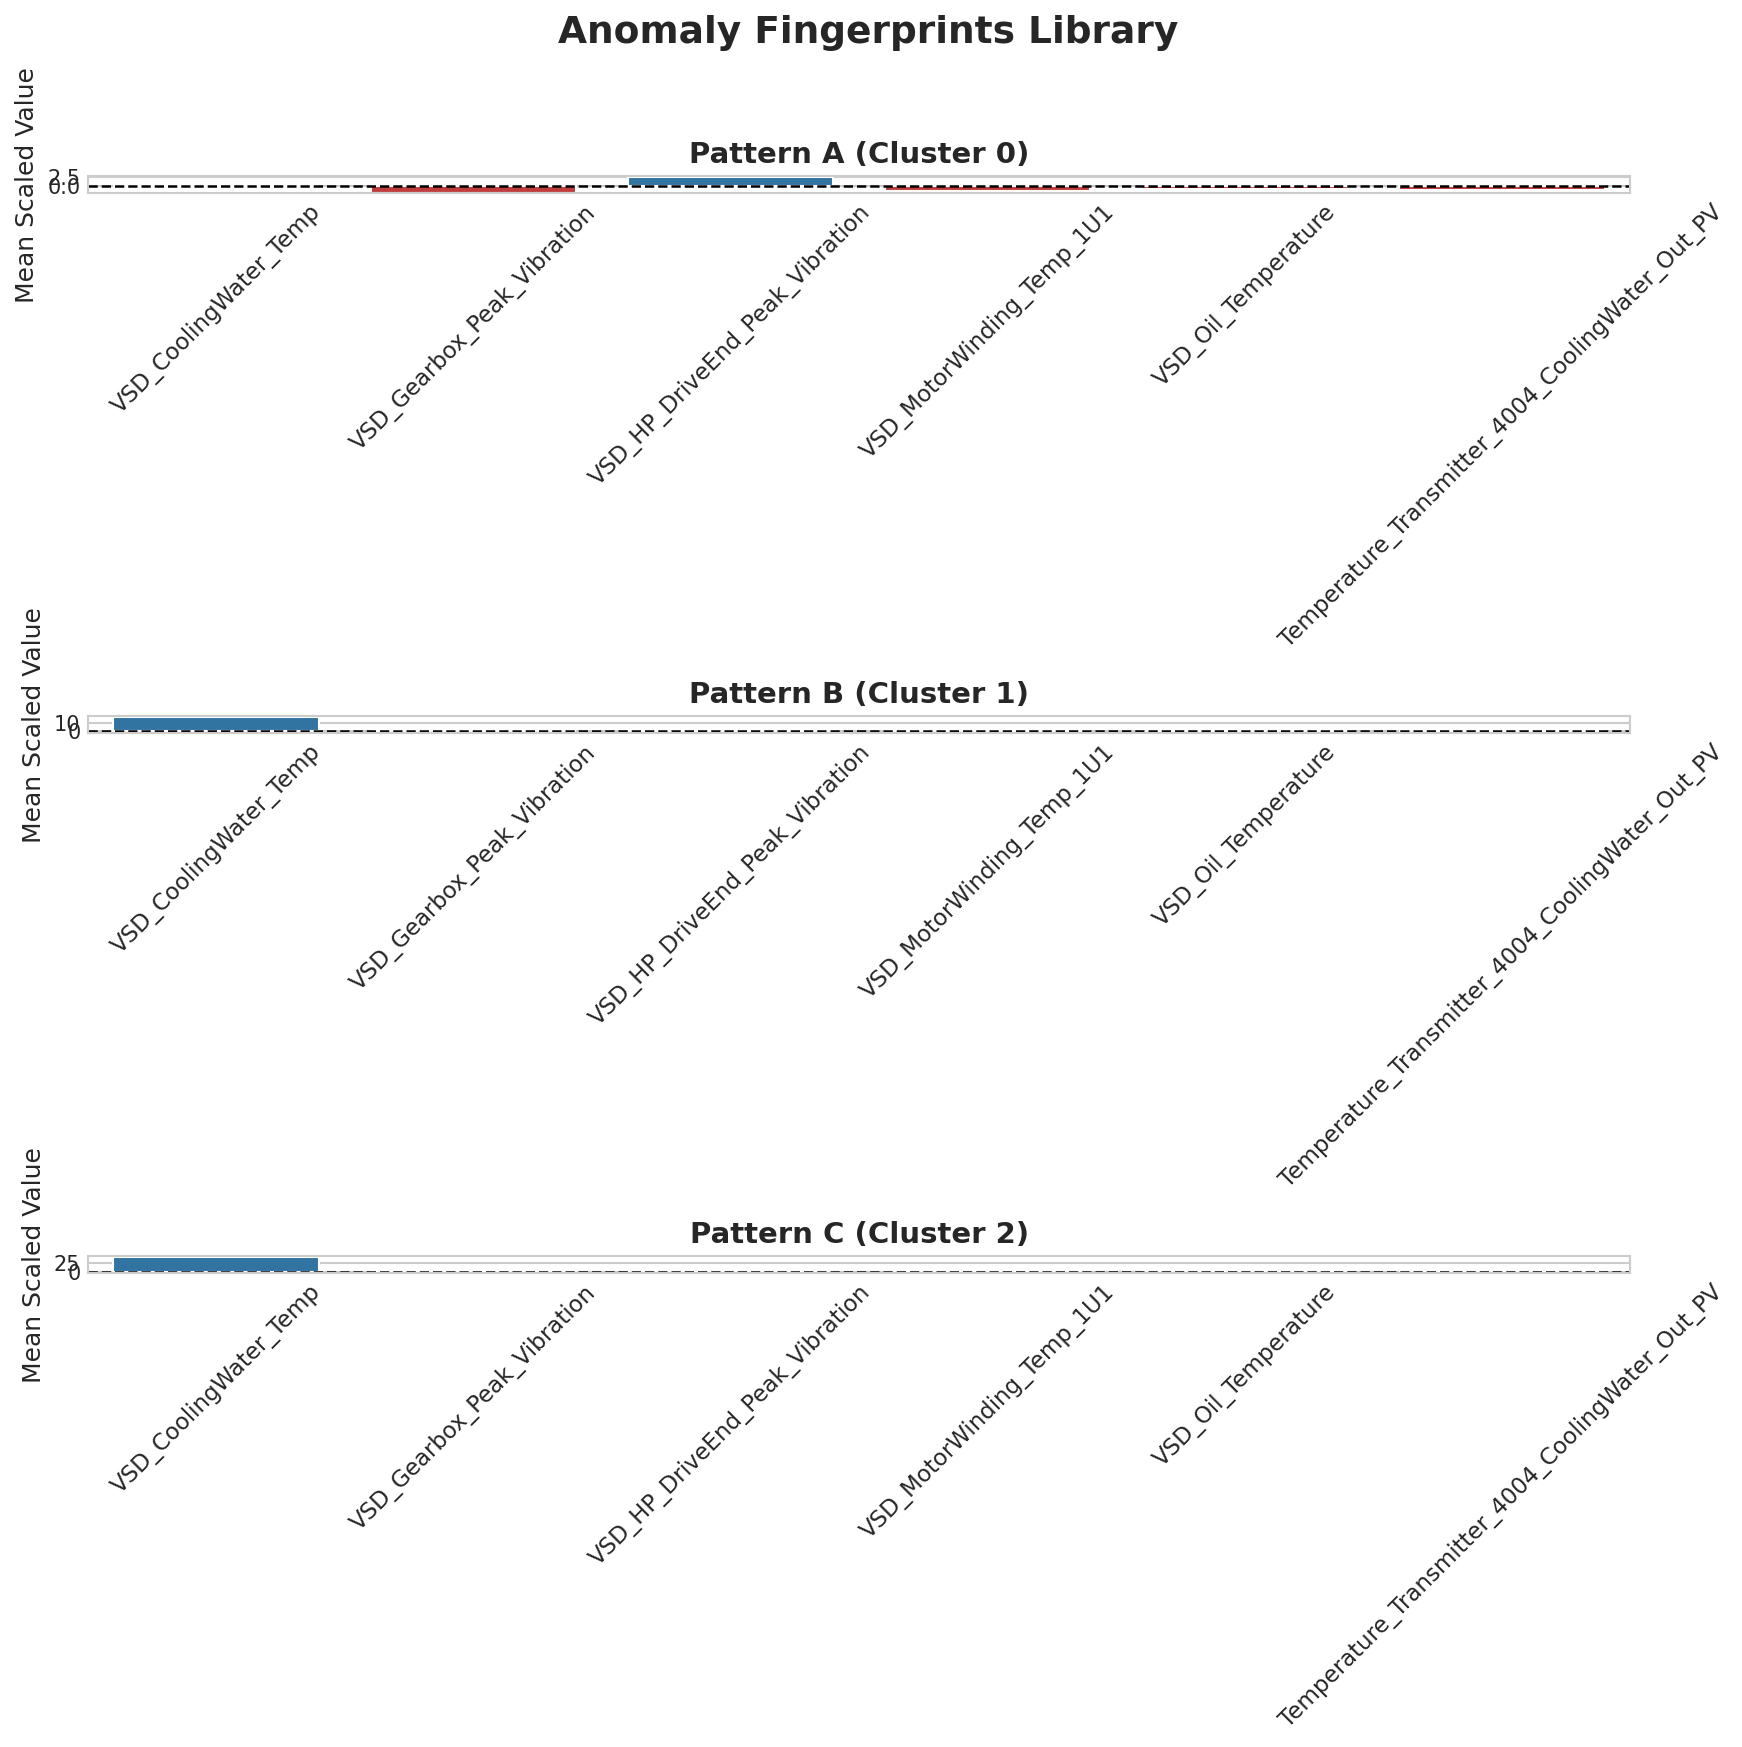
Exhibit 5: The library of recurring issue types. Instead of a generic alarm, we now have specific questions for our experts.
This process created our most powerful new tool: The Anomaly Fingerprints Library. It transforms abstract alerts into focused, tangible lines of inquiry:
- For Fingerprint A (High Vibration): Characterized by a significant increase in vibration. The data asks: Does this signature match the early onset of bearing wear or a known lubrication issue?
- For Fingerprint B (Anomalous Temp Spike): Dominated by a sudden, physically improbable spike in a single sensor. The data asks: Is this sensor faulty, and are we making bad decisions based on bad data?
- For Fingerprint C (Subtle Deviation): A slight, across-the-board shift from the norm. The data asks: Does this correlate with a specific operational phase, or does it represent a new, previously invisible inefficiency?
To make this tangible, the system provides an "Instant Replay" for any event, showing the vital signs at the exact moment of the anomaly and providing a clear starting point for investigation.

The Bottom Line: Quantifying the Business Impact of Inefficiency
The most critical breakthrough is translating these anomalies into quantifiable business impact. We first established a data-driven benchmark for peak performance, identifying the top ~7% of operational periods as the standard for optimal efficiency. The Performance Health Monitor then tracks the compressor's efficiency in near real-time.

The final step is to aggregate the impact of these deviations. The Cumulative Performance Loss chart provides a stark visualization of the total cost of inefficiency, transforming minor issues into a significant business loss.
The Mandate for Leadership: From Pilot to Competitive Edge
This pilot has successfully de-risked the technology and illuminated the path forward. The greatest challenge, however, is not technical; it is organizational. To capture the immense value of this capability, IND_COM must now consciously choose to evolve its processes, culture, and ways of working. Inaction is no longer a neutral choice; it is a decision to fall behind.
The Opportunity Cost of Maintaining the Status Quo
- Operational Risk: Remaining susceptible to perpetual fire-fighting, accepting unplanned downtime and its associated margin erosion as a cost of doing business.
- Knowledge Risk: Relying on the intuition of a few senior experts whose knowledge will leave with them upon retirement. This system begins to codify that expertise into a lasting digital asset.
- Data Integrity Risk: Running operations on a foundation of faulty data, leading to incorrect maintenance actions, wasted resources, and masked operational problems.
- Strategic Risk: The industry is moving towards intelligent, self-diagnosing operations. Choosing not to build this capability is a choice to compete with a permanent handicap.
Prioritized Action Plan & Future Roadmap
This analysis moves beyond findings to a clear, actionable path forward. The following plan outlines immediate actions and strategic initiatives to create a more resilient and efficient operation.
| Priority | Finding / Opportunity | Recommended Action | Lead | Expected Outcome |
|---|---|---|---|---|
| 1 | Fingerprint B: Sensor Malfunction | Investigate and validate the VSD_CoolingWater_Temp sensor. Review all dependent control logic and alarms to assess the historical impact of potentially faulty data. | Maintenance & Controls Engineering | Eliminate false alarms and ensure data integrity for all operational and analytical decisions. A foundational step for building trust in data. |
| 2 | Fingerprint A: High Vibration | Launch a formal Root Cause Analysis (RCA) on the most frequent high-vibration events. Begin with lubrication analysis and bearing inspection. | Reliability Engineering | Identify and mitigate the primary cause of mechanical stress, directly reducing performance loss and the long-term risk of catastrophic failure. |
| 3 | Performance Loss Quantification | Integrate the Performance Loss metric and the Health Monitor dashboard into the weekly operational review meeting to track efficiency in near real-time. | Plant Management | Create continuous visibility of efficiency losses. Foster a culture of proactive performance management and data-driven decision-making. |
| Roadmap | Targeted Component Health Monitoring | (Next Phase) Develop specific sub-models for critical components (e.g., motor, gearbox) to predict degradation and estimate remaining useful life (RUL). | Data Analytics & Reliability Team | Move from general anomaly detection to component-specific prediction, enabling more precise maintenance planning and inventory management. |
| Roadmap | Automated Diagnosis | (Next Phase) Enhance the model to automatically correlate combined fingerprints with specific, labeled root causes (e.g., lubrication vs. bearing wear). | Data Analytics & Operations | Dramatically reduce Mean Time to Repair (MTTR) by moving from anomaly alerts to automated diagnostic recommendations for the operational team. |
What story is your data waiting to tell you?
Related articles

Your Data Is Talking. Here’s How to Listen.
We were handed a raw sensor dataset and a simple question: 'Can you do something with this?' In less time than a coffee break, we transformed that noisy data into a library of actionable 'Anomaly Fingerprints' that can predict failures before they happen. Here’s the step-by-step story.

The Ultimate Machine Learning Cheat Sheet for Non-Specialists
Demystifying machine learning concepts in plain English - a comprehensive guide that breaks down complex ML terminology and models into practical insights anyone can understand.
Ready to get started with ML4Industry?
Discover how our machine learning solutions can help your business decode complex machine data and improve operational efficiency.
Get in touch