Your Data Is Talking. Here’s How to Listen.
We were handed a raw sensor dataset and a simple question: 'Can you do something with this?' In less time than a coffee break, we transformed that noisy data into a library of actionable 'Anomaly Fingerprints' that can predict failures before they happen. Here’s the step-by-step story.

What if the data streaming from your most critical assets isn't just noise? What if it's telling you a story about the future—a story that could prevent your next million-dollar outage?
This is the central question in industrial AI. Recently, a client approached us with this exact challenge. They provided a raw, time-series dataset from a critical VSD compressor and asked a refreshingly honest question: "Can you do something with this?"
They suspected there was value hidden within the data, but they were facing the classic "Decision Latency" crisis: the path from raw data to actionable knowledge was unclear, slow, and resource-intensive.
Our response was to apply the ML4 Autonomous Decision Engine. In less than 20 minutes, we ran an entirely automated analysis that progressed from a raw, uncertain file to a library of specific, recurring failure patterns. This isn't just about speed; it's about a new methodology for rapidly discovering and unlocking value.
Let's walk through this journey, not as a technical report, but as a blueprint for how to listen to what your data is trying to tell you.
The First 5 Minutes: An X-Ray of Your Data's Health
Before you can find a needle in a haystack, you need to understand the haystack. The first phase of our automated analysis is a sanity check—a rapid "Data X-Ray" to establish a health baseline.
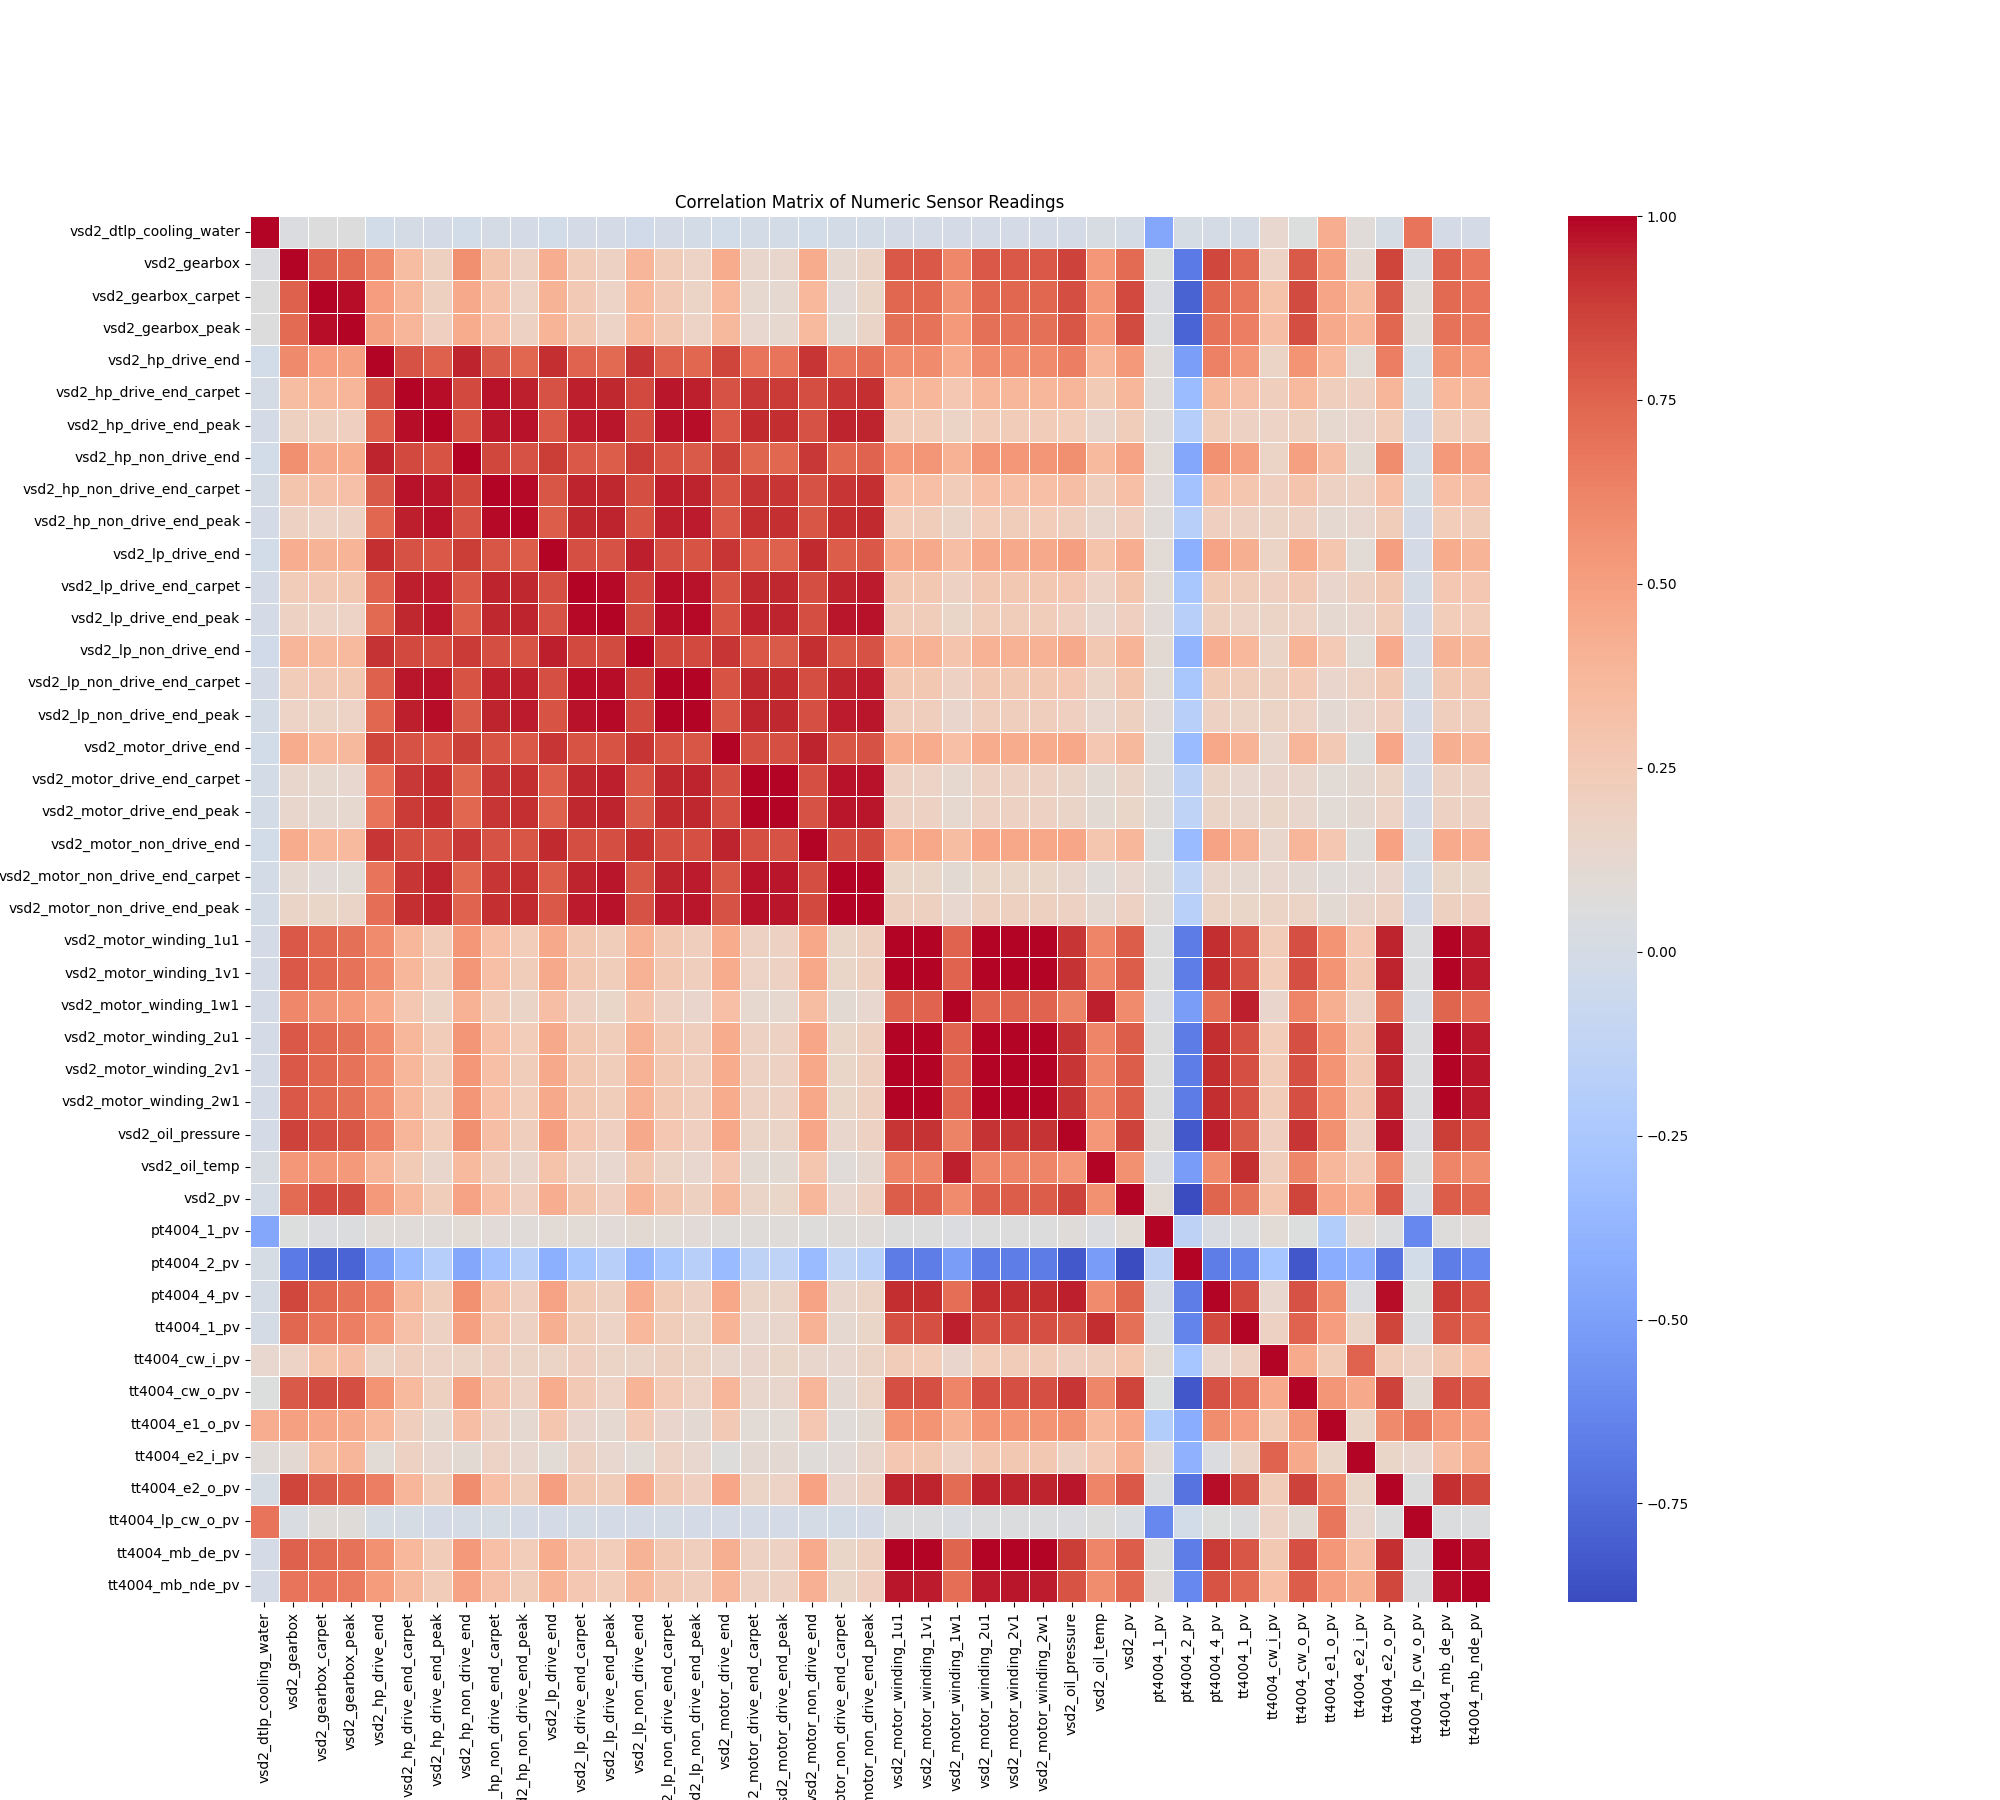
The engine began by transforming the raw data into a structured format, confirming a dataset of over 242,000 records with no significant missing values. It then performed a correlation analysis to understand the relationships between the 8 sensor inputs.

Fig. 1: The 'Data X-Ray' automatically identified redundancies, refining 8 sensor inputs down to 6 core "Vital Signs."
This analysis immediately identified redundancies. Based on this, the system automatically removed two features, creating a core set of 6 "Vital Signs" that truly represent the equipment's health baseline. In just five minutes, we moved from a noisy collection of sensors to a concise and meaningful health profile.
The Next 10 Minutes: Finding the Needle in the Haystack
With a clean baseline of "Vital Signs," the next question is: "What does normal look like?"
The engine trained an Isolation Forest model—a highly effective algorithm for this task—on the refined data to learn the equipment's normal operating behavior. It then generated a continuous anomaly score for the entire dataset. An anomaly threshold was automatically set at the 99th percentile, instructing the system to flag only the top 1% of the most statistically unusual events for review.
This process identified 2,413 distinct anomalous events. But an alert that just says "something is different" isn't an answer; it's more noise. The key is to provide immediate context.
Making Sense of an Alert: The 'Instant Replay'
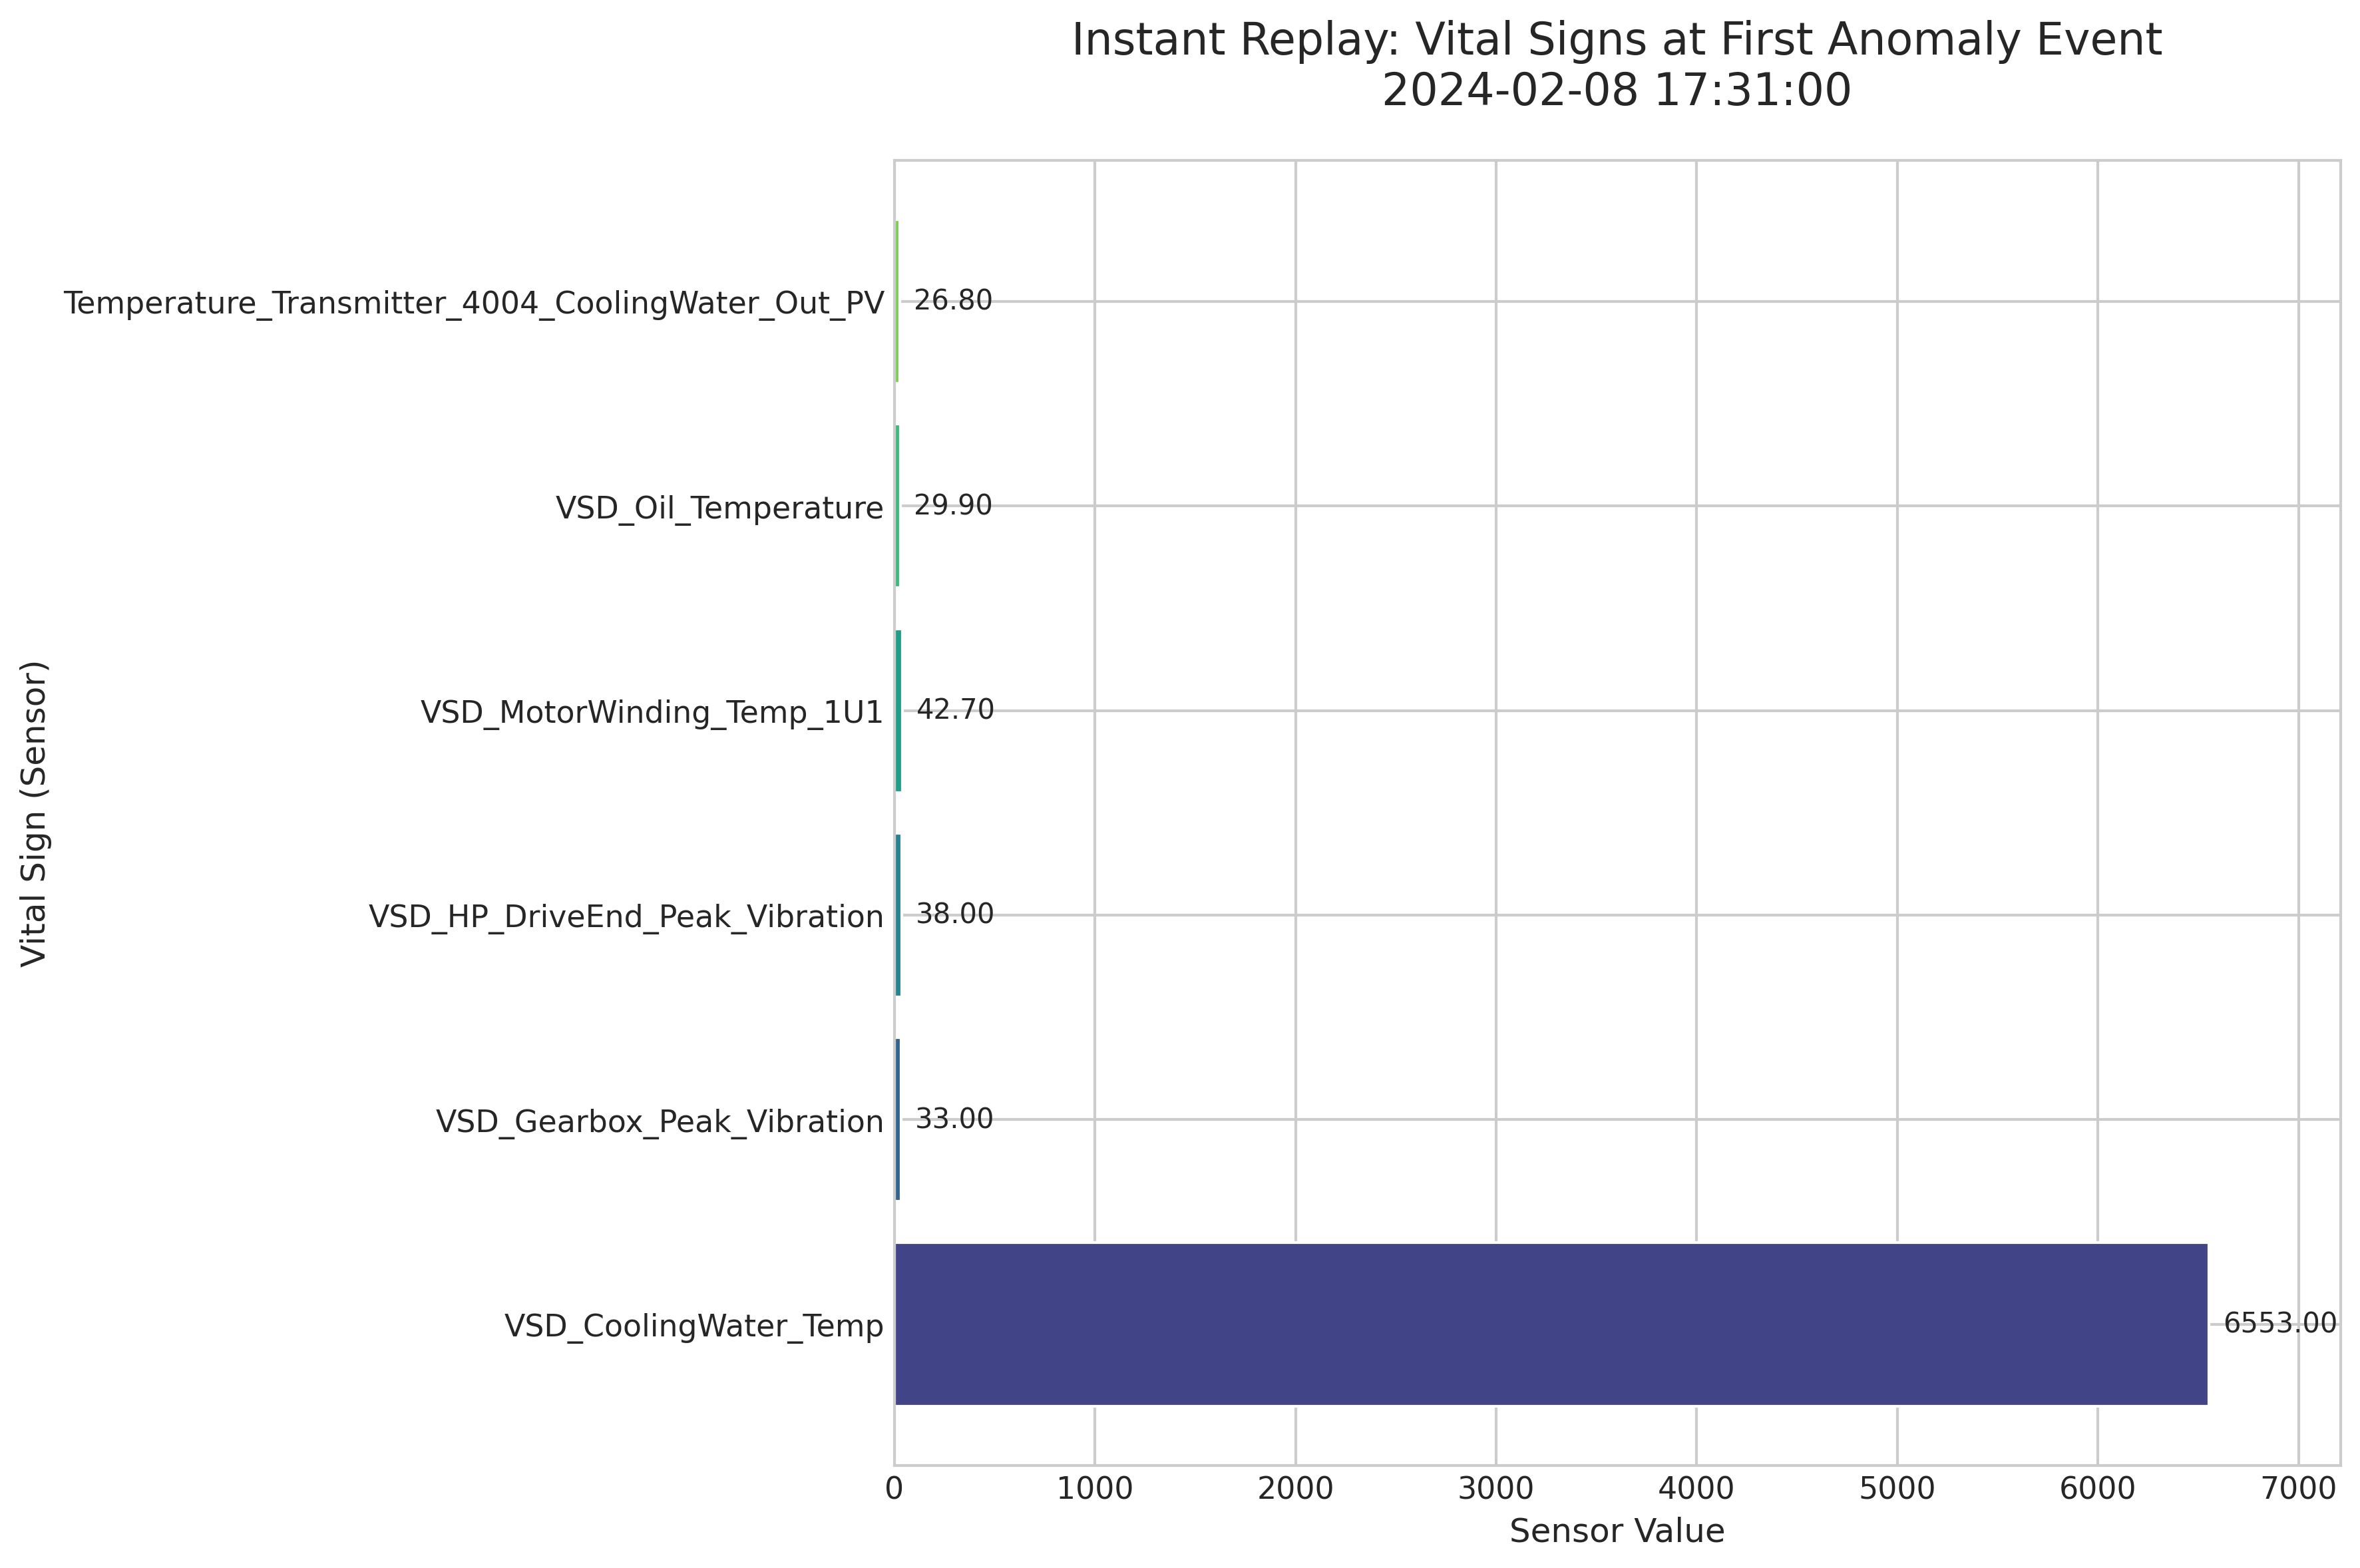
Imagine your equipment is a patient in the ER. When an alarm goes off (an anomaly), the first thing a doctor does is check the patient's vital signs. Our engine does the same. For the very first anomaly flagged, the system generated an "Instant Replay" snapshot.

Fig. 2: This "doctor's clipboard" immediately shows that a massive spike in cooling water temperature triggered the alert.
At a glance, the diagnosis is obvious. Five of the six vital signs were in a low, normal range. But the VSD_CoolingWater_Temp sensor reported an extraordinarily high value of 6553.00. This snapshot eliminates the need for manual investigation and immediately points the engineering team to the likely source of the problem, saving valuable diagnostic time.
The Final 5 Minutes: From Noise to Actionable Intelligence
Identifying 2,413 individual anomalies is a start, but it can lead to alert fatigue. The real breakthrough comes from answering the next question: "Are these anomalies random, or are there recurring patterns of failure?"
In the final phase, the engine analyzed all 2,413 events using a K-Means clustering algorithm. It programmatically determined that the anomalies naturally group into 3 distinct clusters. For each cluster, the system calculated an average "fingerprint" representing the typical sensor behavior for that type of event.
This automatically generated an Anomaly Fingerprints Library—a visual catalog of recurring issue types, labeled Pattern A, B, and C.
But How Do We Know These Patterns Are Real?
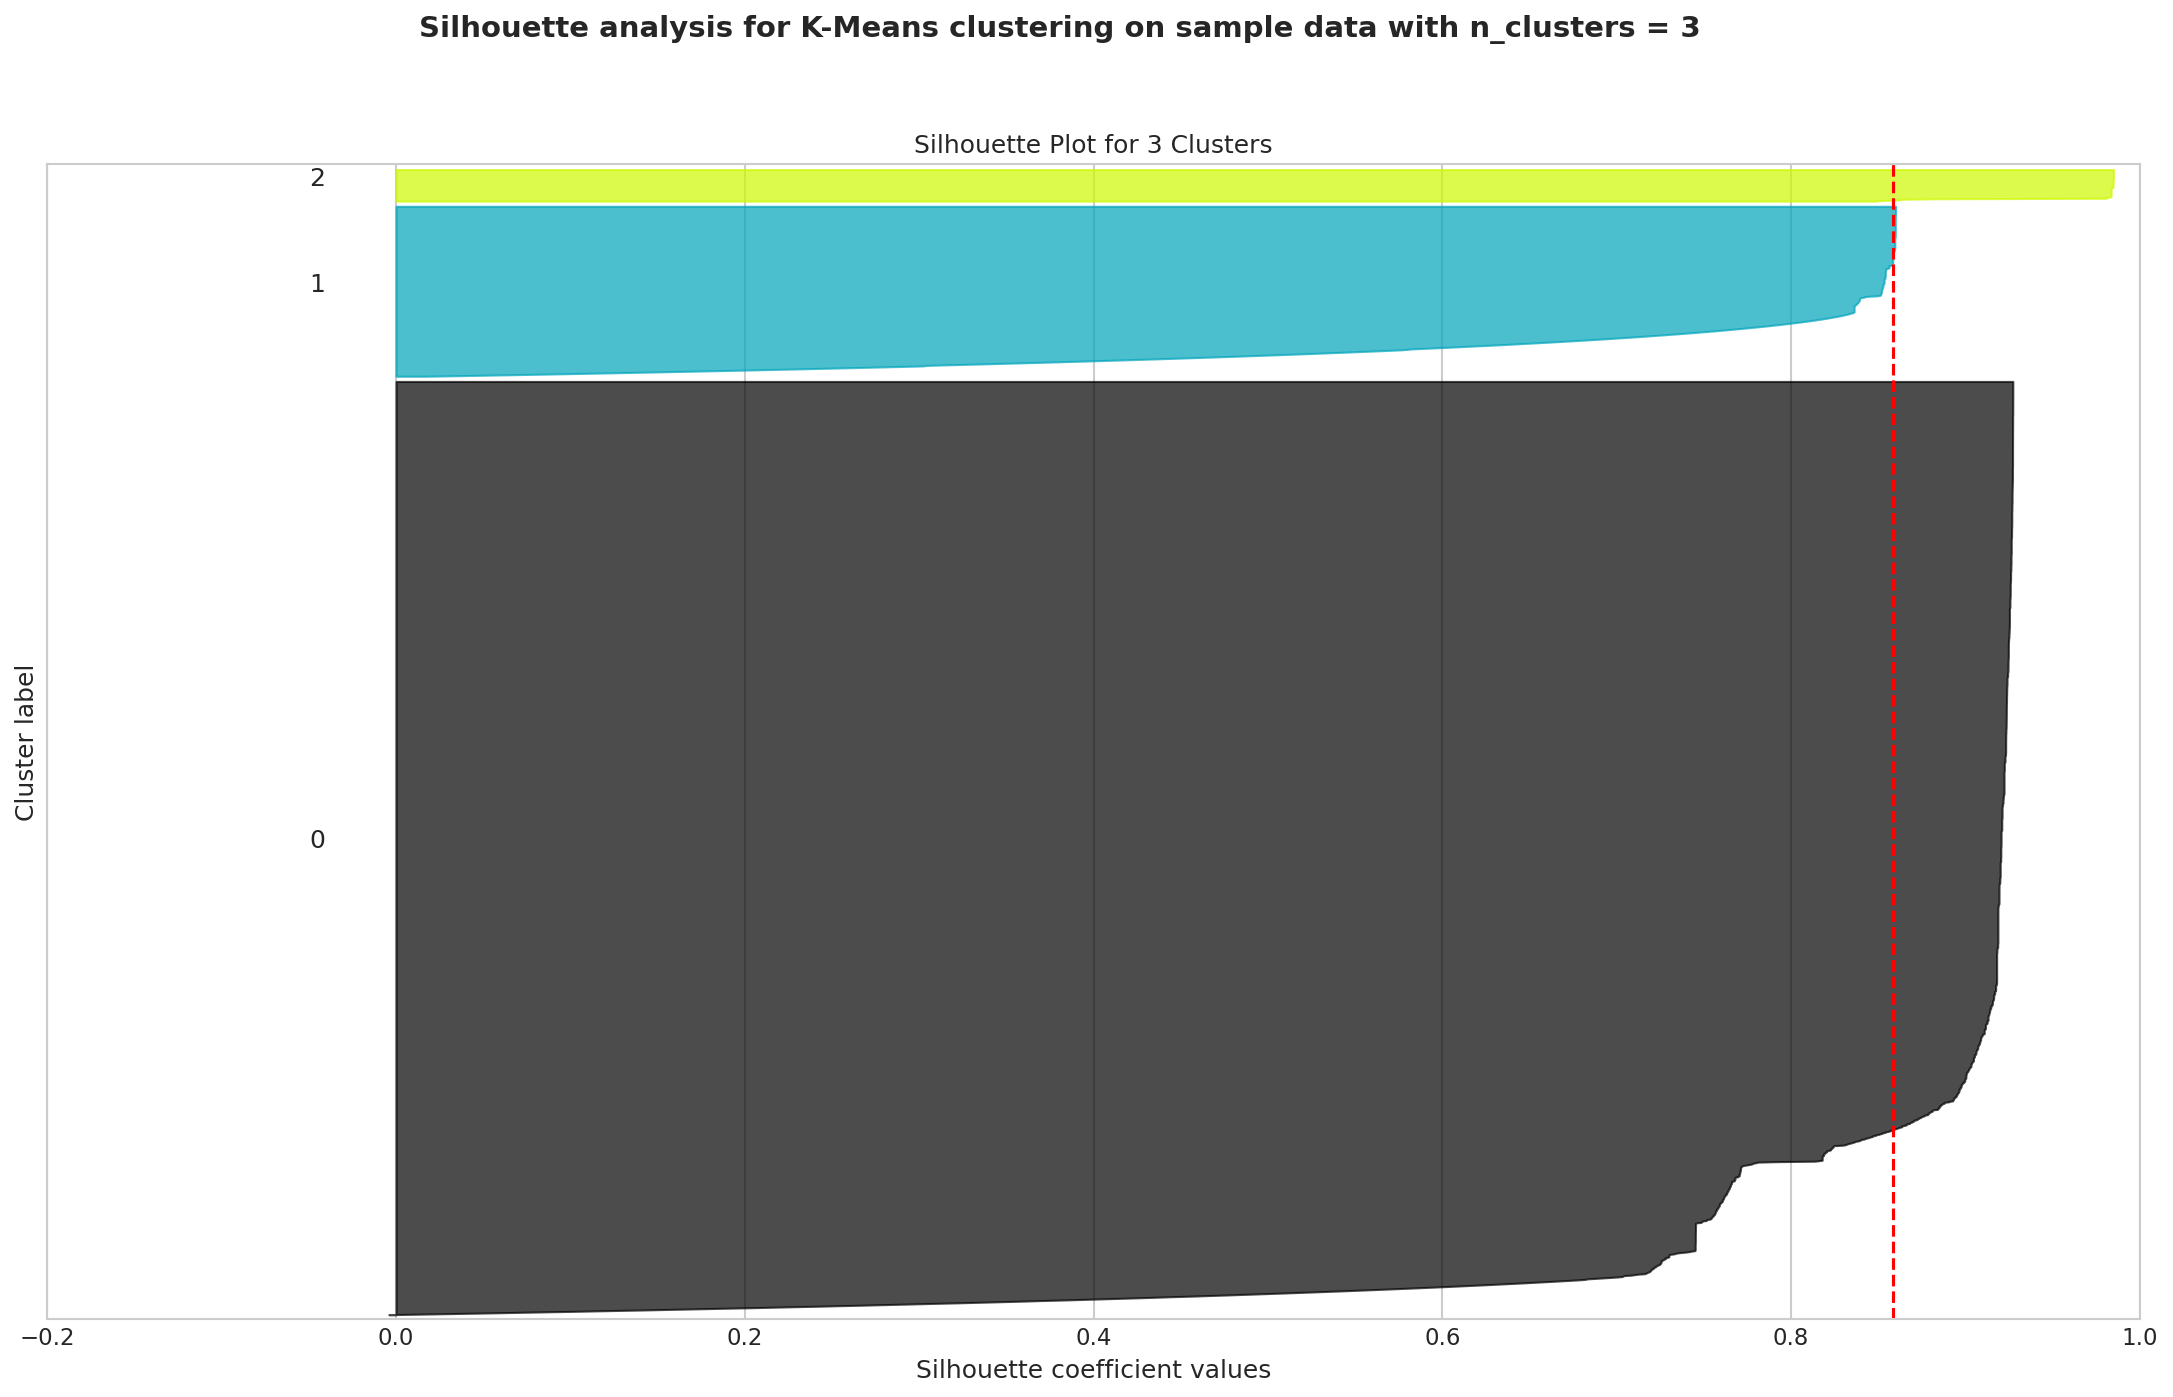
This is a critical question. The answer lies in the Silhouette Plot—a quality-control check for the clustering process. Think of it like assigning team jerseys. A high score means each player (anomaly) is very close to their own teammates (their cluster) and very far from their opponents (other clusters).

Fig. 3: An excellent silhouette score of 0.86 provides mathematical proof that the discovered patterns are real and distinct.
Our analysis achieved a silhouette score of 0.86—an excellent result that validates the fingerprints are not a random fluke. They are real, statistically significant, and distinct patterns within the data.
The Business Impact: The Only Way to Win Is to Begin
This 20-minute, automated process unlocked a significant business opportunity by providing the foundation to shift maintenance from a reactive to a proactive stance. Instead of responding to failures, teams can now investigate data-defined patterns of abnormal behavior before they escalate. The "Anomaly Fingerprints" library provides a concrete starting point for domain experts to label recurring issues (e.g., "Pattern A is early-stage bearing wear"), enabling faster diagnosis and more targeted maintenance.
This journey highlights a fundamental truth of industrial AI: even if data is perceived as poor, it is not garbage. The most important lesson is to start. This simple analysis represents the first step on a powerful maturity curve:
- Understand Your Data: Create a baseline of "normal."
- Detect Anomalies: Flag when something is different.
- Discover Patterns: Group anomalies into recurring "fingerprints."
- Add Context: Use domain experts to label these patterns.
- Predict & Prevent: Evolve from detection to true prognostics.
The only reason this profound insight was unlocked is because the journey began. The value was always latent in the data, waiting to be discovered.
What story is your data waiting to tell you?
Related articles

From an Avalanche of Alerts to a Dialogue of Diagnosis: The C101 Compressor Story
We analyzed over 242,000 sensor records from a critical compressor, transforming a constant stream of noisy alerts into a clear, diagnostic language. This is the story of how we used machine learning to discover the hidden 'fingerprints' of inefficiency and failure, creating a data-driven roadmap to proactive maintenance and quantifiable business impact.

The Ultimate Machine Learning Cheat Sheet for Non-Specialists
Demystifying machine learning concepts in plain English - a comprehensive guide that breaks down complex ML terminology and models into practical insights anyone can understand.
Ready to get started with ML4Industry?
Discover how our machine learning solutions can help your business decode complex machine data and improve operational efficiency.
Get in touch